
Gold’s COT improved with commercials reducing their short positions by 32,330 contracts. However, it remains moderately bearish at 351,473.
The non-commercial (large speculators) in silver increased their net-short position for the third straight week. Again, the last time we saw this was in 2003 (see bullish silver chart).
There was mild selling on strength numbers for GDX and GLD. The dollar amount was uninteresting; I’m mentioning it because they ranked first and second on the list.
Metals and Miners have consolidated for 2-months, and a significant move is brewing. Prices could spike lower first, but that’s unclear (at the moment). Long-term investors may consider adding to core physical holdings. Short-term traders should remain patient or risk additional whipsaws.
Oil and stocks formed bearish reversals on Friday. I see the potential for expedited selling if key support fails next week. If established, I’ll consider adding to my SCO (short oil) position.
-US DOLLAR- The trendline is the likely target if prices rise further in April. There is no clear short-term cycle to guide us.

-GOLD WEEKLY- Prices are consolidating just below the all-important (green) bull market breakout line. The structure is similar to that of 2016. However, this doesn’t necessarily guarantee a downward result. Sentiment is neutral to bearish, and prices could easily break upward from the consolidation. Trading will be easier when gold finally breaks above $1377 and begins to trend. However, the real money will be made when gold reaches new all-time highs above $2000. That is when public participation will build, and a speculative bubble will spread similar to what we witnessed in bitcoin.

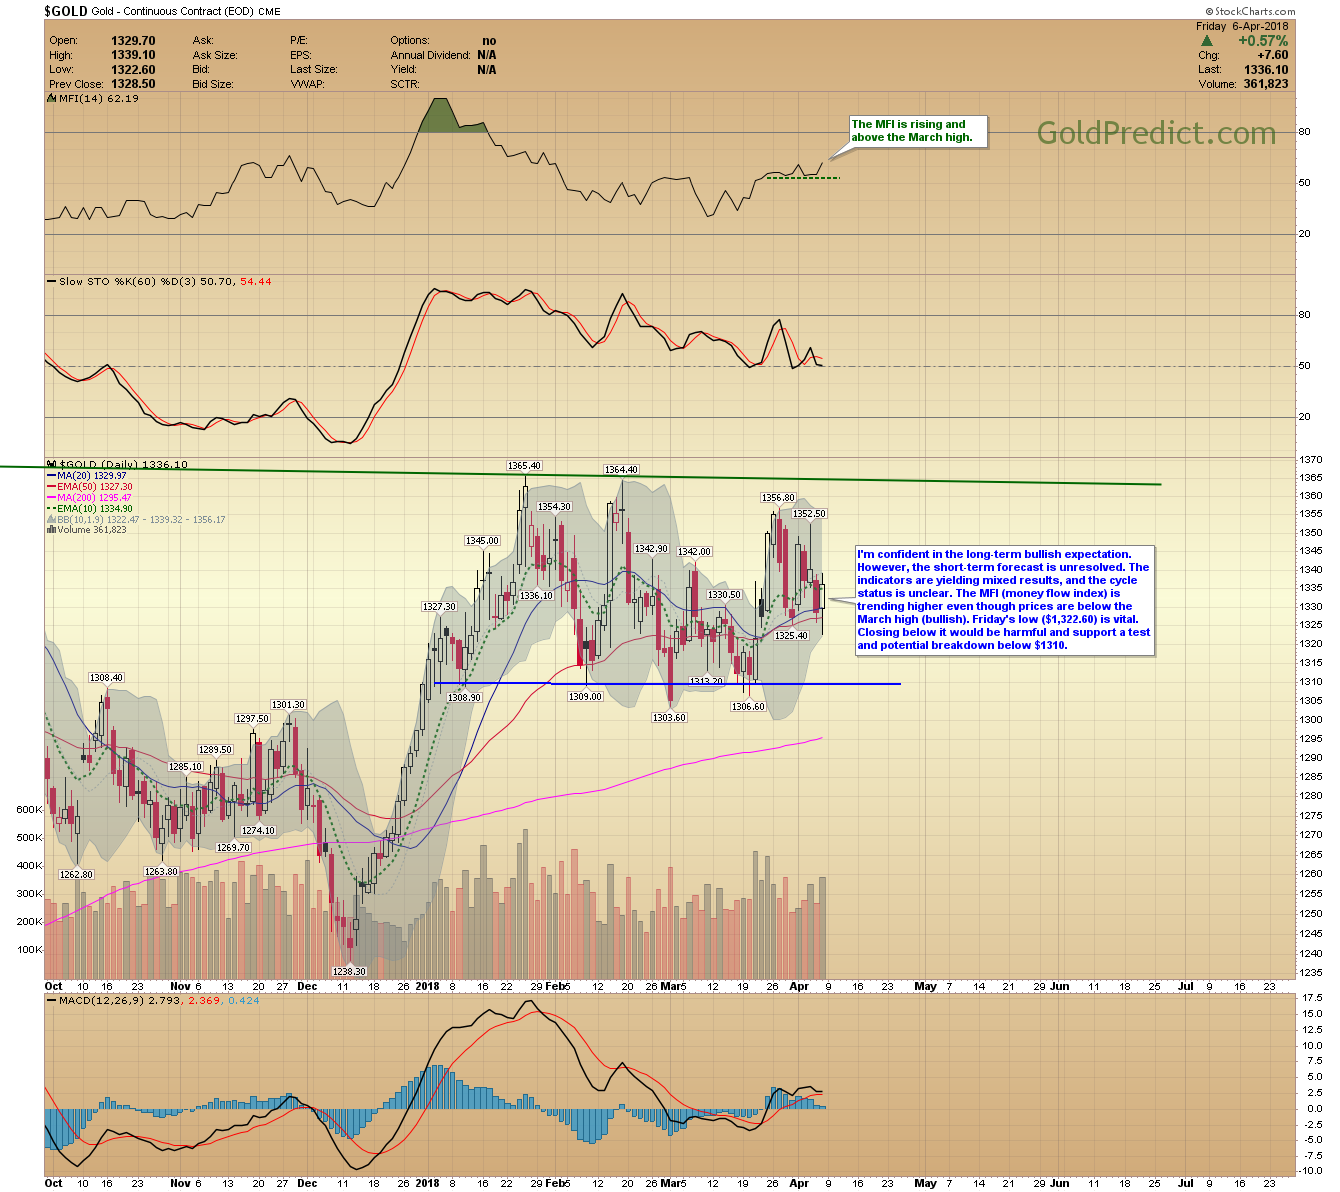
-GOLD DAILY- I’m confident in the long-term bullish expectation. However, the short-term forecast is unresolved. The indicators are yielding mixed results, and the cycle status is unclear. The MFI (money flow index) is trending higher even though prices are below the March high (bullish). Friday’s low ($1,322.60) is vital. Closing below it would be harmful and support a test and potential breakdown below $1310.
-BULLISH SILVER CHART- The last time non-commercials (large speculators) were net short was in 2003. Prices consolidated for several months and then broke sharply higher. Breaking out above the consolidation line would support a $26.00 target by late 2018 to early 2019.

-SILVER WEEKLY- The March 23rd COT report revealed the first net short by non-commercials since 2003. They’ve increased their net-shorts three straight weeks to 16,965 contracts. Meanwhile, commercials (smart money) are low at 89,053. Together this presents a bullish situation for silver.
Prices are sideways, and volatility is low (see bottom indicator). Periods of low volatility lead to sharp moves. That combined with bullish COT report recommends a robust upward breakout at some point – the question is when.

-SILVER DAILY- The 2-month range continues. Silver needs to break above $17.00 or below $16.00 to resolve the stalemate. The bullish COT supports higher prices, but we can’t rule out a quick spike lower first.

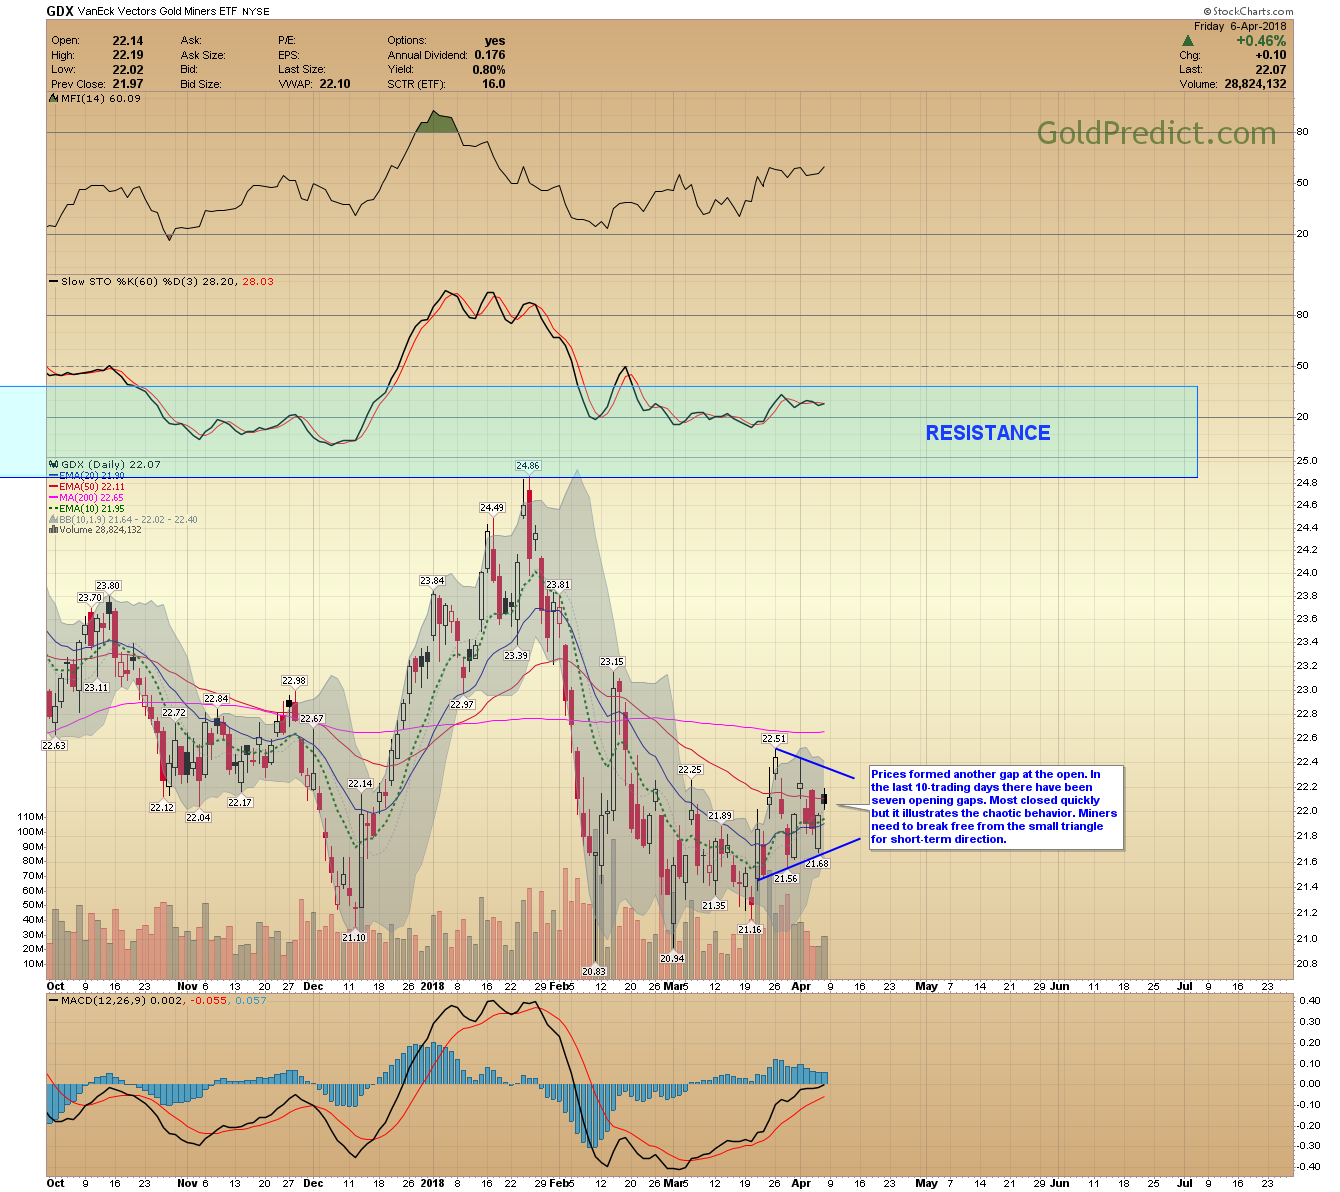
-GDX- Prices formed another gap at the open. In the last 10-trading days there have been seven opening gaps. Most closed quickly but it illustrates the chaotic behavior. Miners need to break free from the small triangle for short-term direction.
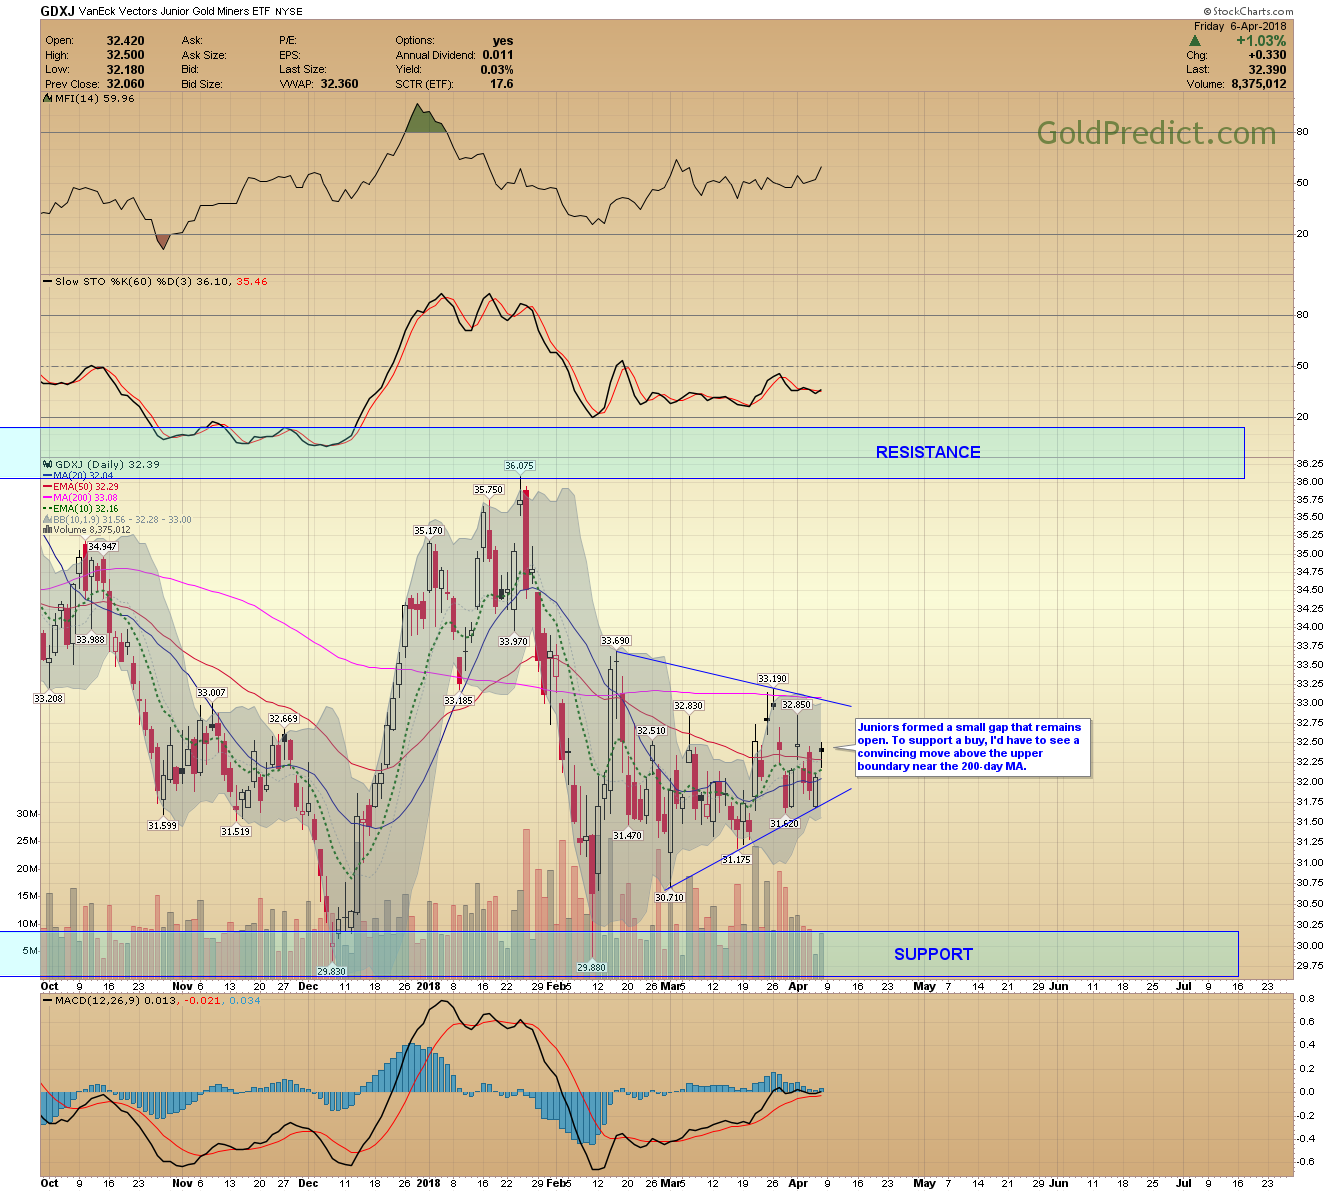
-GDXJ- Juniors formed a small gap that remains open. To support a buy, I’d have to see a convincing move above the upper boundary near the 200-day MA.
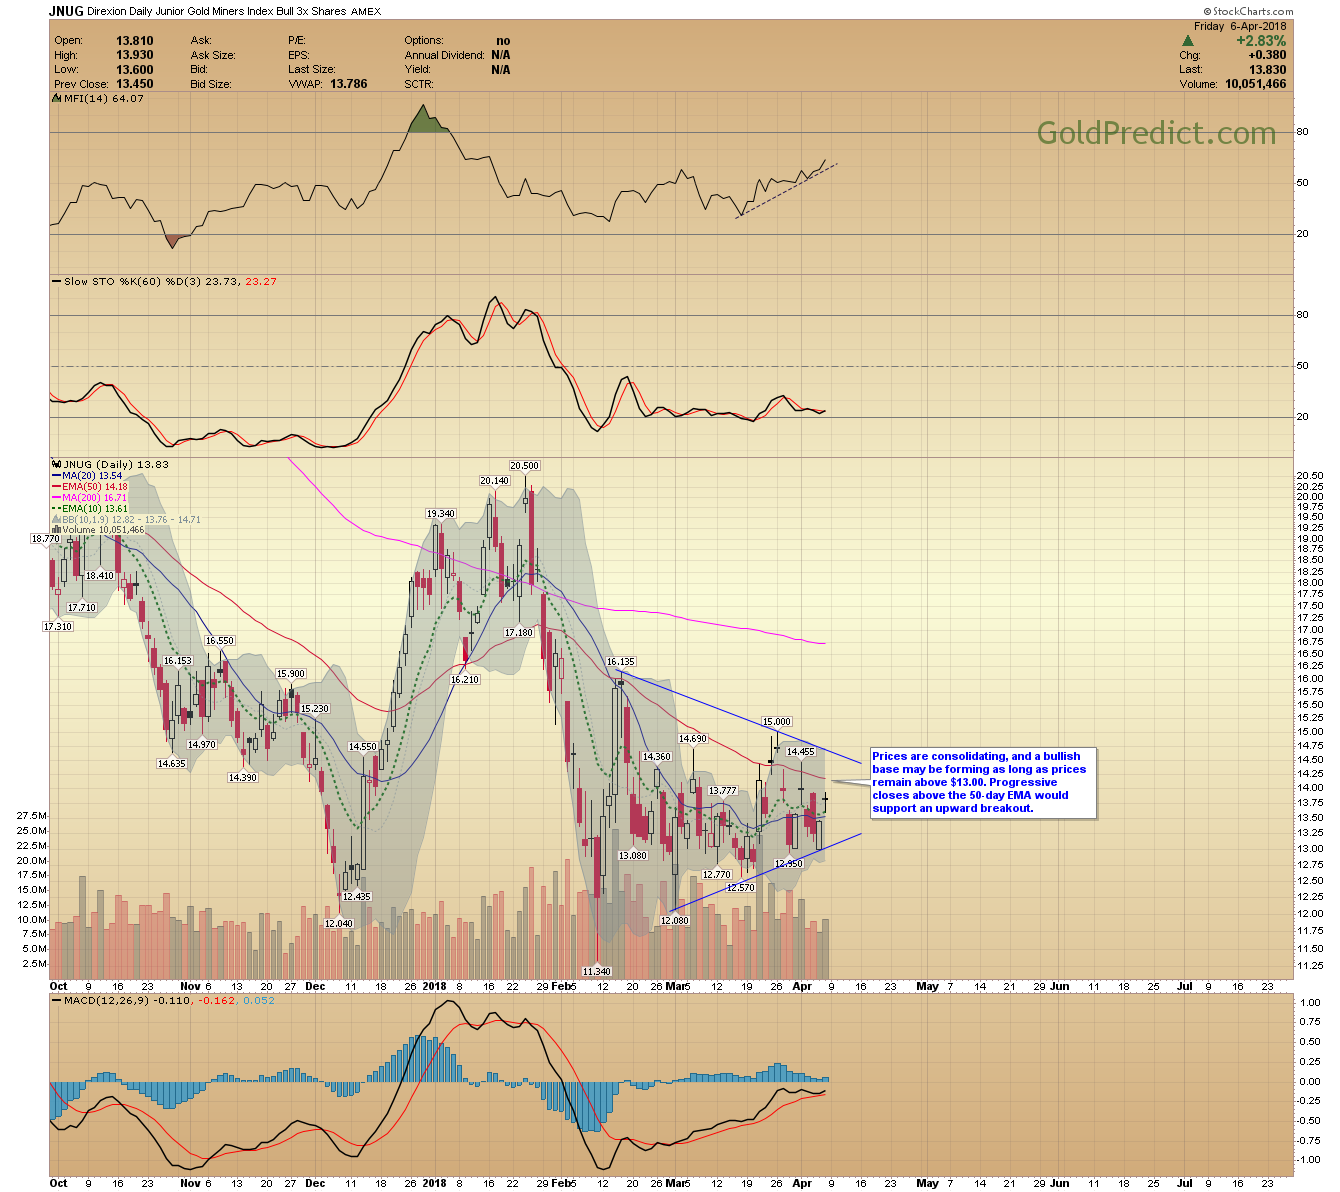
-JNUG- Prices are consolidating, and a bullish base may be forming as long as prices remain above $13.00. Progressive closes above the 50-day EMA would support an upward breakout.
-USLV- The bullish potential in silver is moving. However, I’d like to see evidence of a breakout before buying USLV.

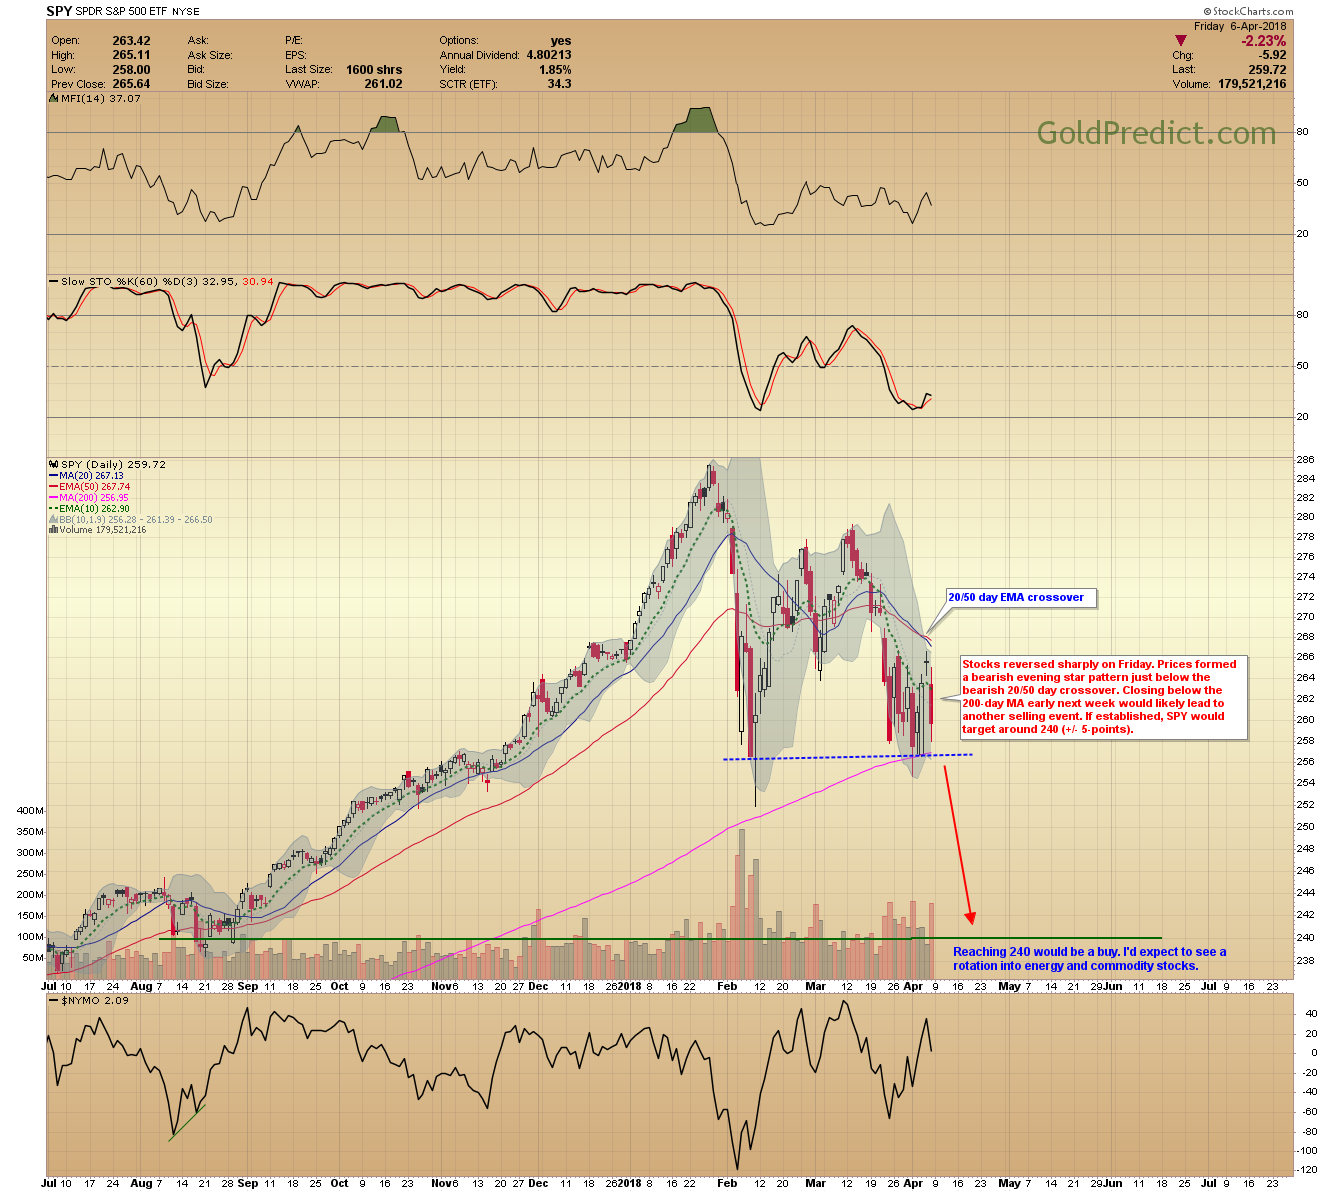
-SPY- Stocks reversed sharply on Friday. Prices formed a bearish evening star pattern just below the bearish 20/50 day crossover. Closing below the 200-day MA early next week would likely lead to another selling event. If established, SPY would target around 240 (+/- 5-points). Reaching 240 would be a buy. I’d expect to see a rotation into energy and commodity stocks.
-WTIC WEEKLY- Oil formed a weekly bearish evening star pattern and potential double top. To confirm a double top (very important), prices need to close below $58.07 on a weekly basis. For targets, analysts typically subtract the height of the pattern from the bottom ($58.07), proposing a decline to $50.50. If established, I’d be surprised if prices fell much beyond the $55.00 breakout point.

-WTIC DAILY- Oil closed bearishly, but there is one more support level to overcome…the short-term trendline. Breaking sharply below that would encourage a decline to the rising 200-day MA and prior support near $56.00.

-SCO- Oil reaching $56.00 would imply an SCO target of $26.00. I’d probably begin scaling out above $25.00. I’ll consider adding to the trade if I like what I see next week.

Have a great weekend.