
We are getting a bounce in metals and miners, and this could last up to two weeks. I see some bullish potential in the metals charts and if my maximum bounce levels fail to hold I will need to reevaluate the situation. Several factors are pointing to an even deeper correction still, but it’s not a guarantee.
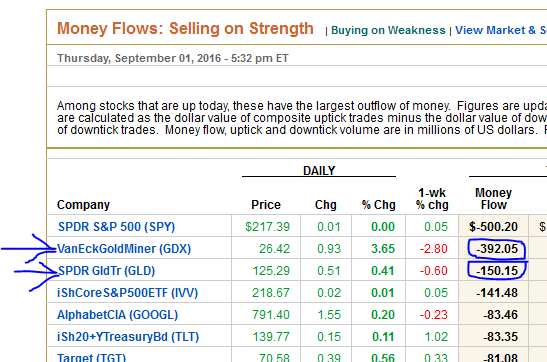
The fact that the dollar finished positive on Friday after weak employment data combined with back-to-back selling on strength numbers (below) in miners and metals supports this is likely just a bounce that will fail.
-SELLING INTO STRENGTH- Both Thursday and Friday had selling into strength numbers for metals and miners. Figures provided by the Wall Street Journal.
Thursday
Friday

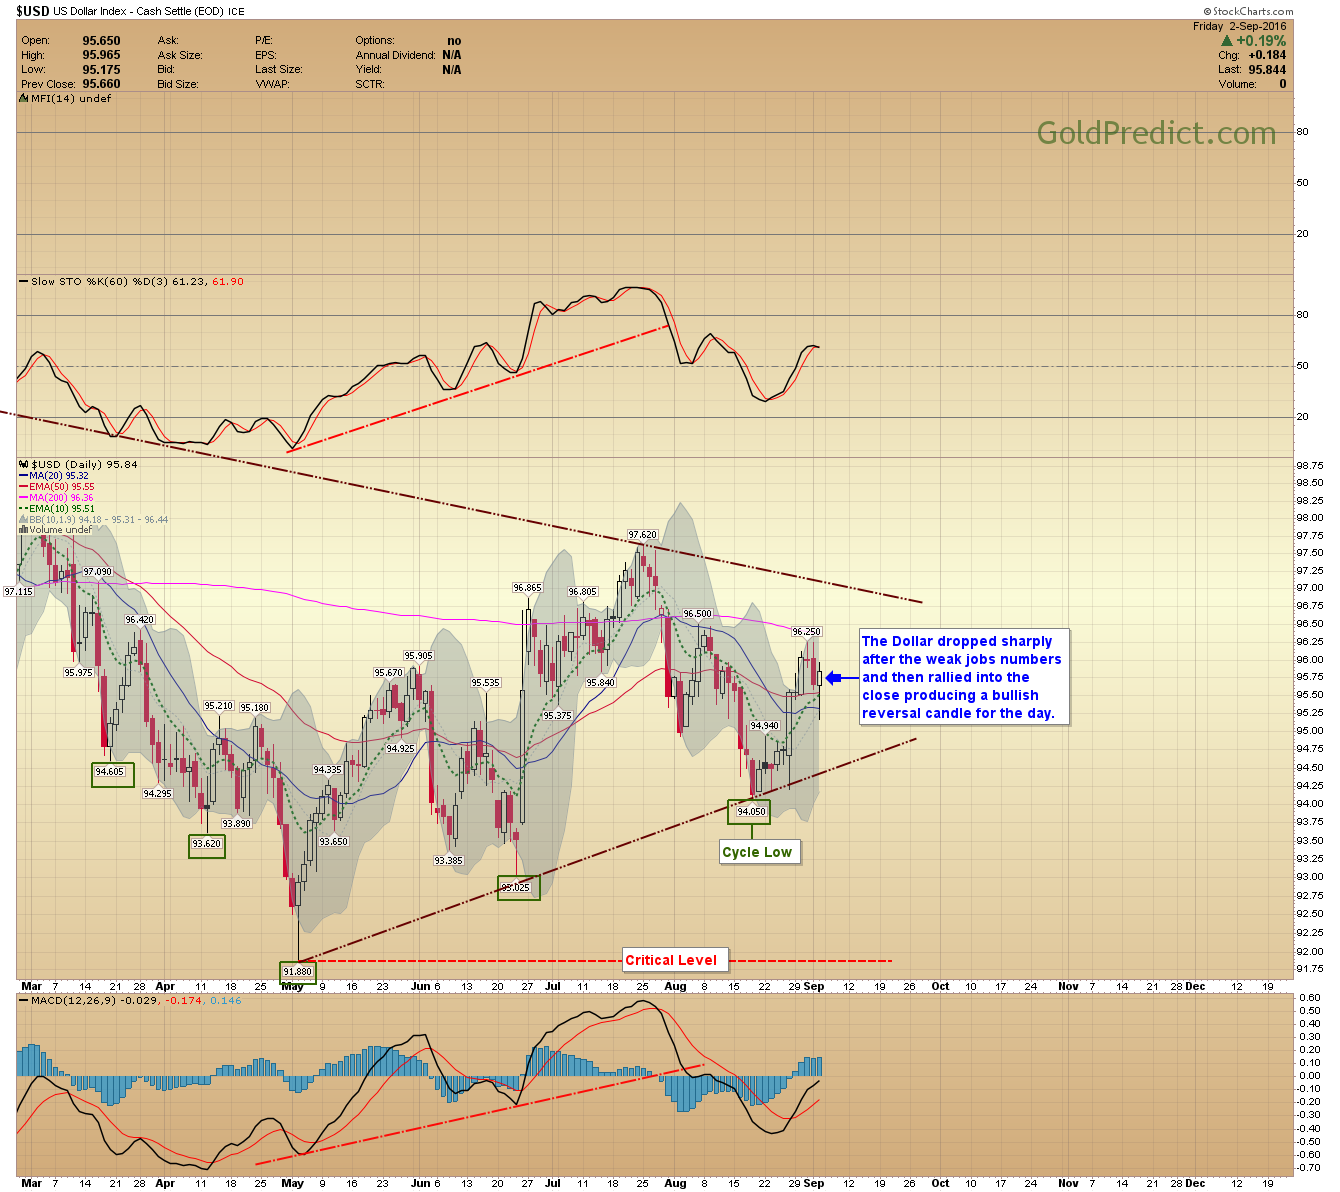
-US DOLLAR- The Dollar dropped sharply after the weak jobs numbers and then rallied into the close producing a bullish reversal for the day.
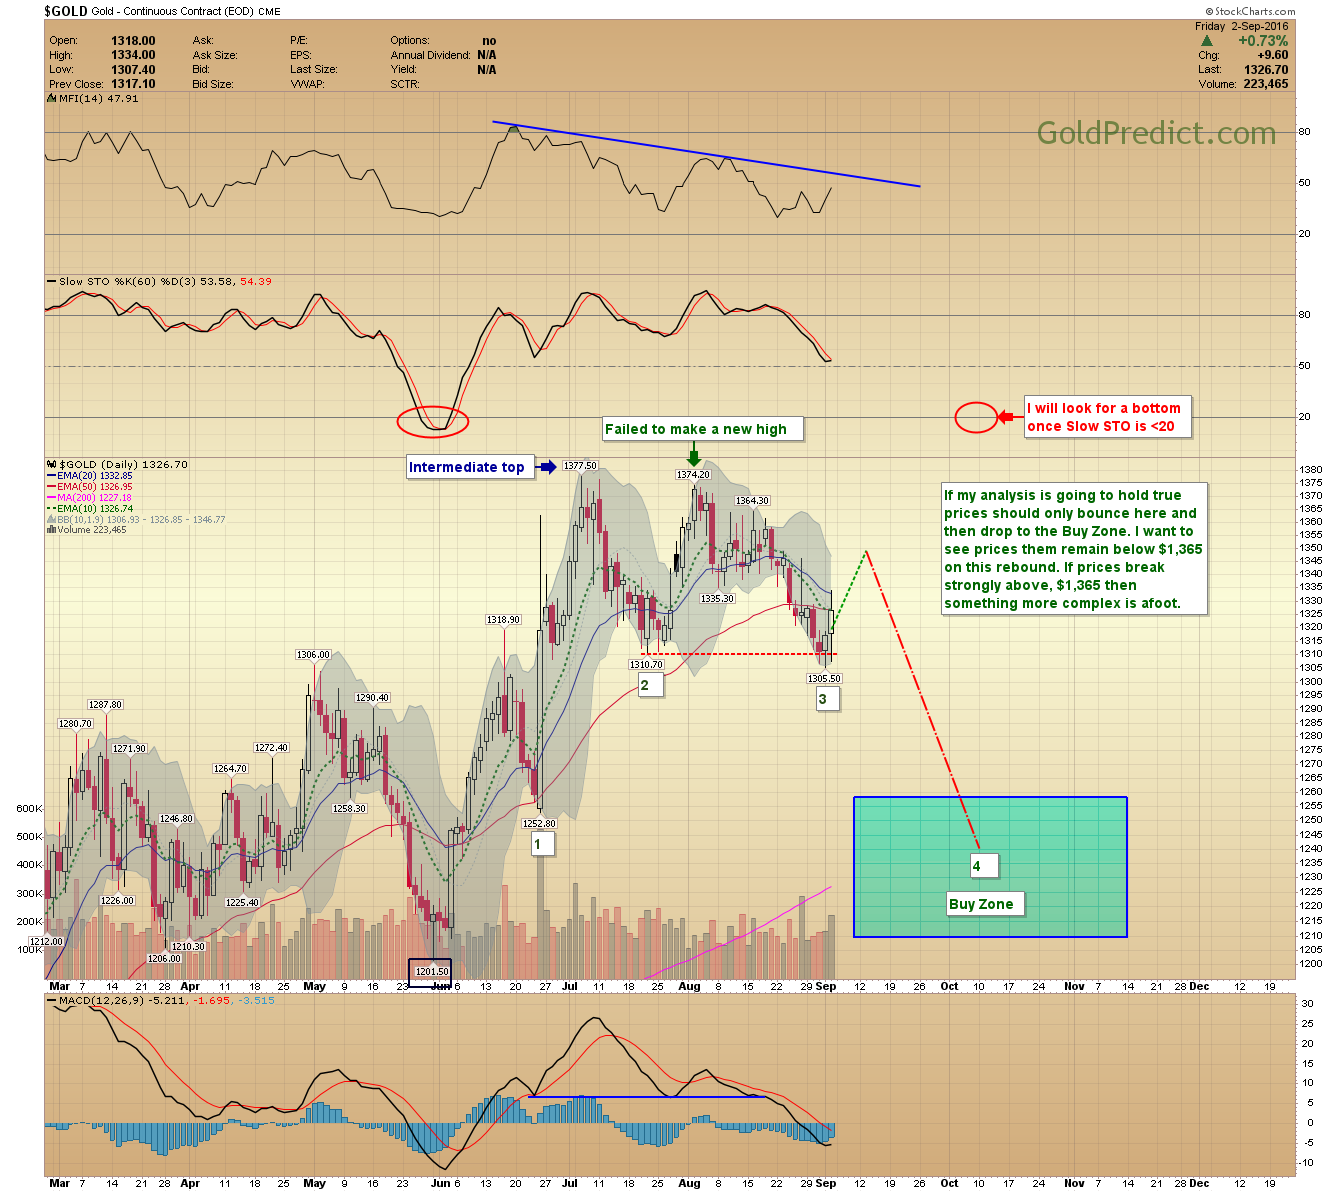
-GOLD- If my analysis is going to hold true, prices should only bounce here and then drop to the Buy Zone. I want to see prices remain below $1,365 on this rebound. If prices break strongly above, $1,365 then something more complex is afoot.
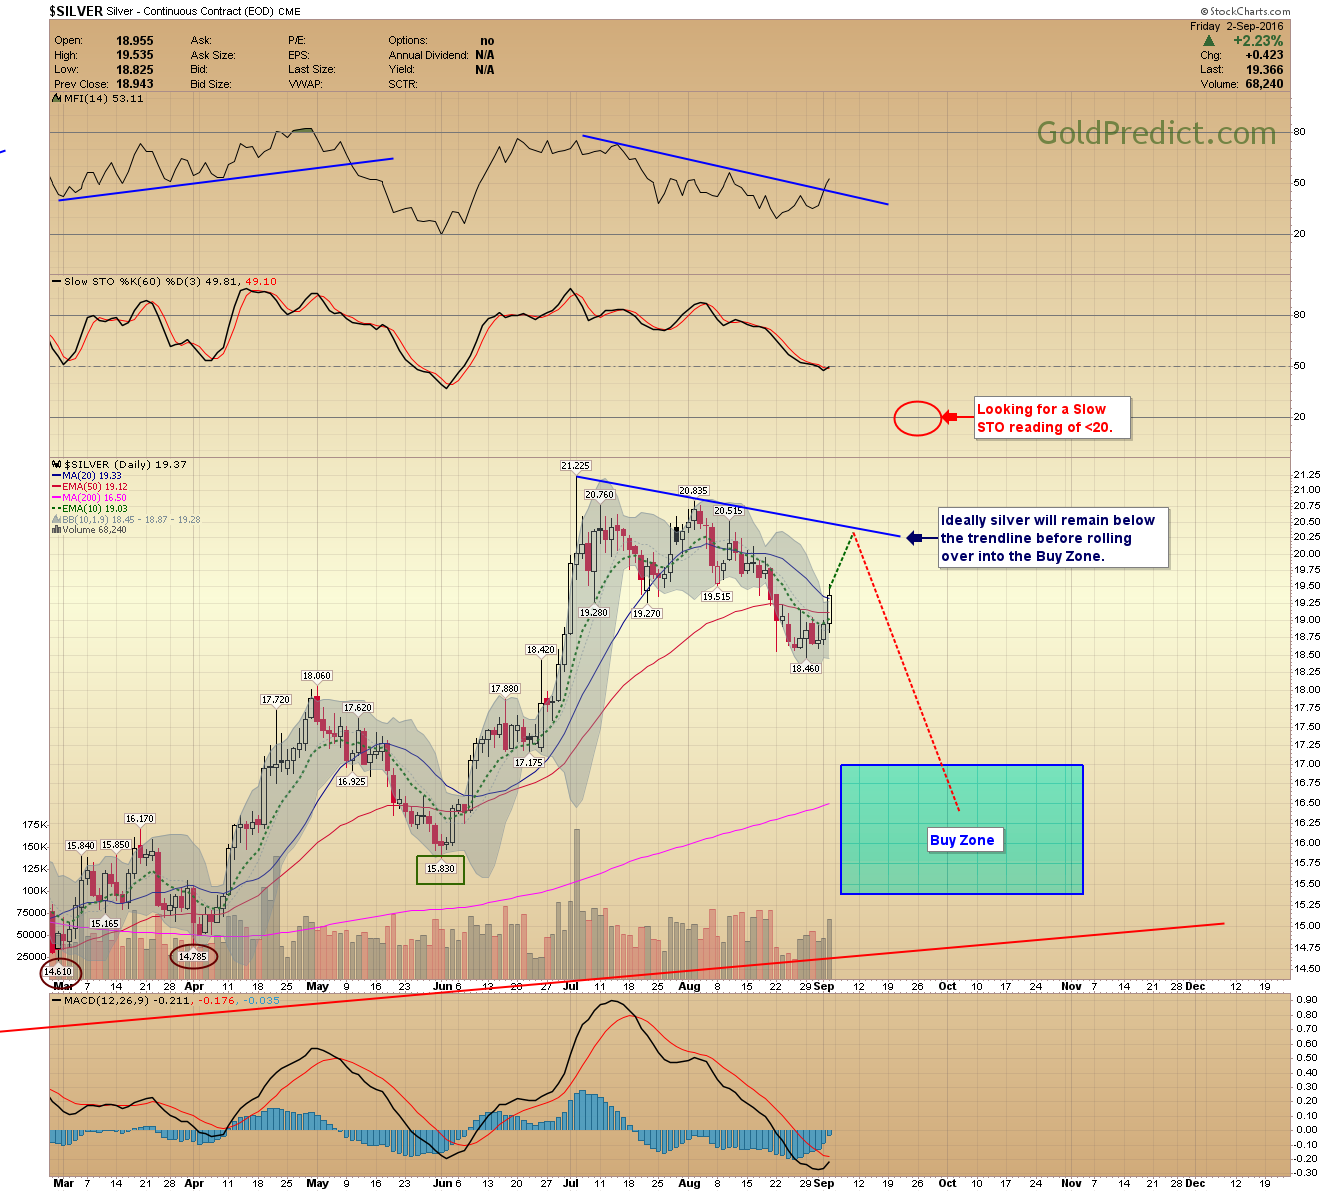
-SILVER- Ideally silver will remain below the trendline before rolling over into the Buy Zone.
-HUI- Weekly HUI prices ended with a bullish reversal candle. However, they have fallen short of the 38.2% Fibonacci retracement (a minimum target). Nor have they reached oversold levels on a weekly basis. Suggesting a more profound correction is still warranted. RSI (7) should at least touch the 30 level during a meaningful correction.

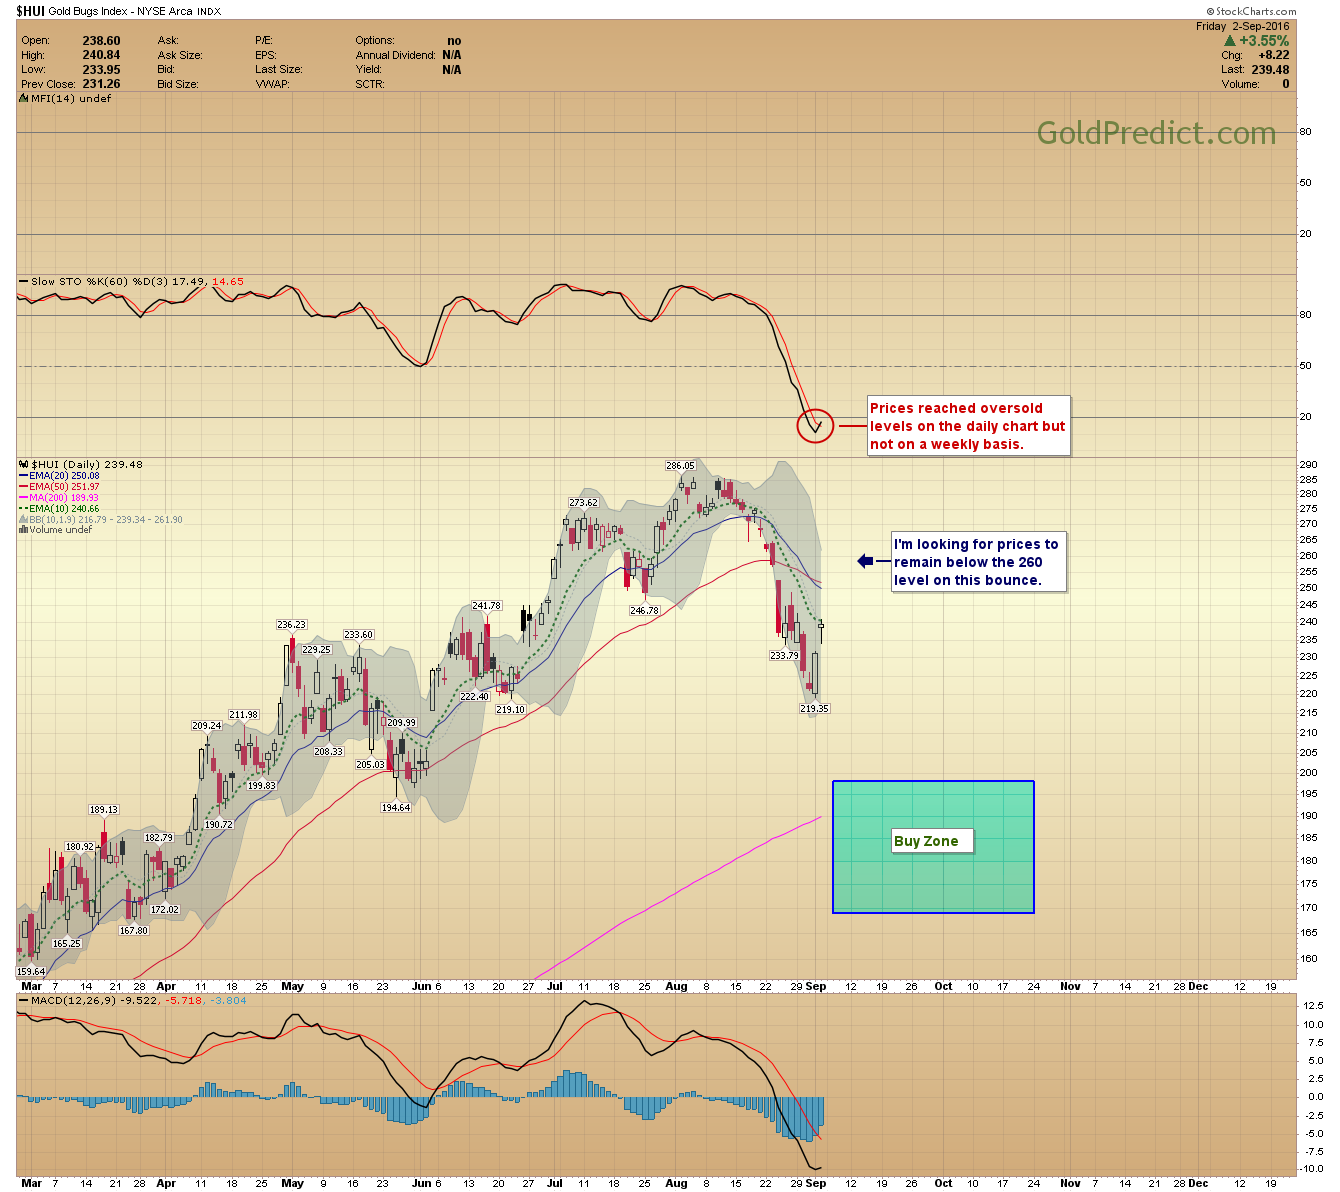
-HUI DAILY- Prices reached oversold levels on the daily chart but not on a weekly basis. I’m looking for prices to remain below the 260 level during this bounce.
-GDX- The level to hold in GDX is $29.50.

-GDXJ- I want to see GDXJ prices stay below $50.30 during this bounce.

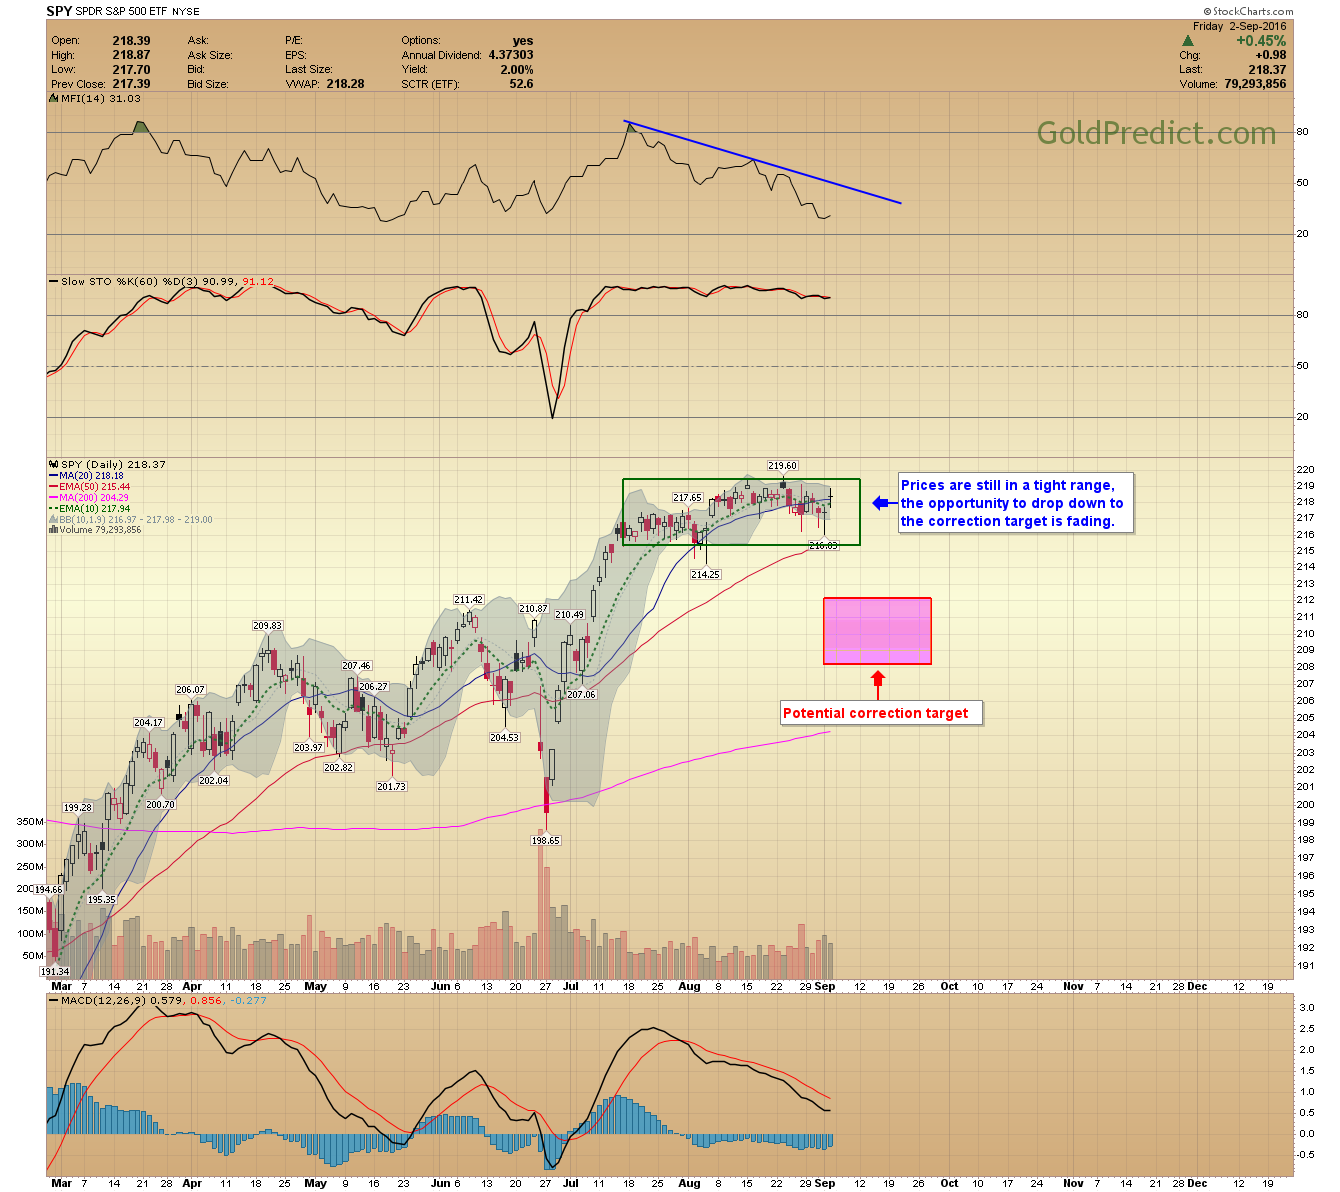
-SPY- Prices are still in a tight range, the opportunity to drop to the correction target is fading.
-WTIC- Oil bounced on Friday, but the chart and fundamentals are suggesting further weakness ahead.

-OIL INVENTORIES- Take note of the blue line in the chart below provided by Tom McClellan. It depicts US Oil and Gas inventories at record highs. With the driving season over these numbers are likely to rise even further. Eventually, storage facilities will reach maximum capacity, and the excess oil will be put to market. That will drive prices lower and potentially all the way down to $20.00 a barrel.

I will be watching the next couple weeks for signs of strength or weakness in the metals and miners complex. I still like our chances for an even deeper correction, but they are not making it easy.