
Gold finally broke the October low, and prices should bottom within the next 1-4 weeks. A low is possible next week if prices suddenly spike below $1,215. In December 2015/2016 gold bottomed 1-day after the FED’s rate hike (see rate hike chart).
Conflicting Data: Rate hike timing supports a low next week, but the Commitment of Traders (COT) suggests otherwise. Commercial shorts in gold declined to 322,399 contracts. A sharp reduction from the previous 363,372 contracts, but still moderately high. I usually like to see positions drop below 250,000 contracts before calling for a low. Consequently, it could take a couple more weeks of declining prices to unwind the short positions properly.
Miners are also at a crossroads. On the one hand, positive divergences are forming, and the downtrend appears to be slowing. However, on the other hand, I still see the potential for a collapse below support. The HUI:GOLD ratio is flirting with a critical level.
Expect multiple updates next week. I’ll issue a buy signal and provide an entry strategy if gold declines to our projected target zone ($1,210-$1,200). If prices don’t bottom next week, then I will expect the low to arrive later in December or early January.
-US DOLLAR- The dollar tested the 94.10 level and pulled back. Prices would have to rally and stay above 94.10 for a few days to neutralize the immediate downtrend. If established, prices should find resistance at the 200-day MA.

-GOLD WEEKLY- The weekly chart broke October support and closed below $1,250. We should see commercial short positions drop below 250,000 (currently 322,399) before finding a bottom. Technical analysis supports a decline to the rising trendline around $1,200.

-GOLD DAILY- Prices are below the October low, but the bulls are yet to capitulate. Volatility will likely increase during next weeks FED meeting. Gold would have to close consecutively above the 200-day MA ($1,268.34) to suggest a premature bottom. Otherwise, we expect prices to continue lower towards the $1,200 level.

-FED RATE HIKES AND GOLD- After slashing rates to 0%-0.25% in December 2008, the FED slowly started to advance rates in December 2015. The first rate increase corresponded with a major bear market low in gold. Since then, the FED has risen rates three times. Gold has bottomed with each expansion, particularly if it transpired in December.

-SILVER WEEKLY- The trend in silver is a mess, and there is no discernable pattern. Prices could drop and test the spike low ($14.34), but I’m not sure.

-SILVER DAILY- The MFI is oversold, and prices bounced after 8-consecutive down days. We could see increased volatility next week. Prices should bottom with gold. Whatever the case, physical silver is a good long-term buy at these levels.

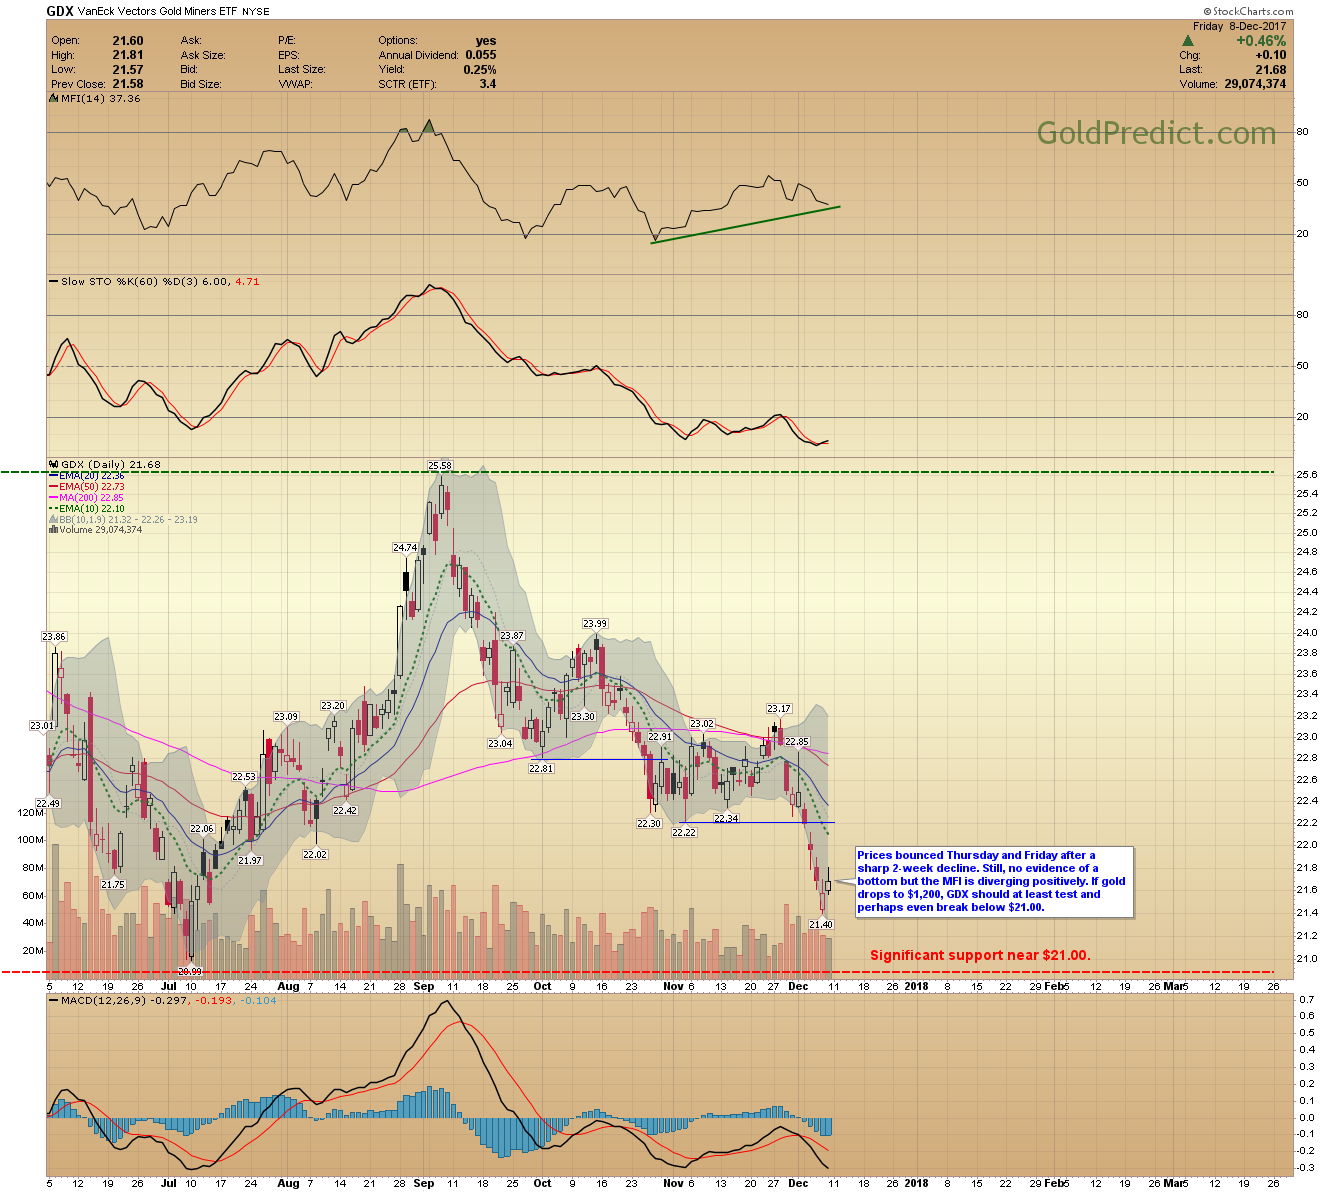
-GDX- Prices bounced Thursday and Friday after a sharp 2-week decline. Still, no evidence of a bottom but the MFI is diverging positively. If gold drops to $1,200, GDX should at least test and perhaps even break below $21.00.
-HUI:GOLD RATIO- The ratio fell below support Wednesday and Thursday. However, it managed to climb its way back and ended the week above support (0.1418). Declining below last weeks low (0.1390) might be enough to push GDX through important support around $21.00.

-GDXJ- Juniors are attempting to bounce. The MFI and MACD are diverging positively. Momentum to the downside appears to be slowing. Prices would have to close consecutively above the $31.00 level to support a bottom.

-SPY- Prices rallied Friday and produced a new closing high. We should see prices continue to work their way higher into January.

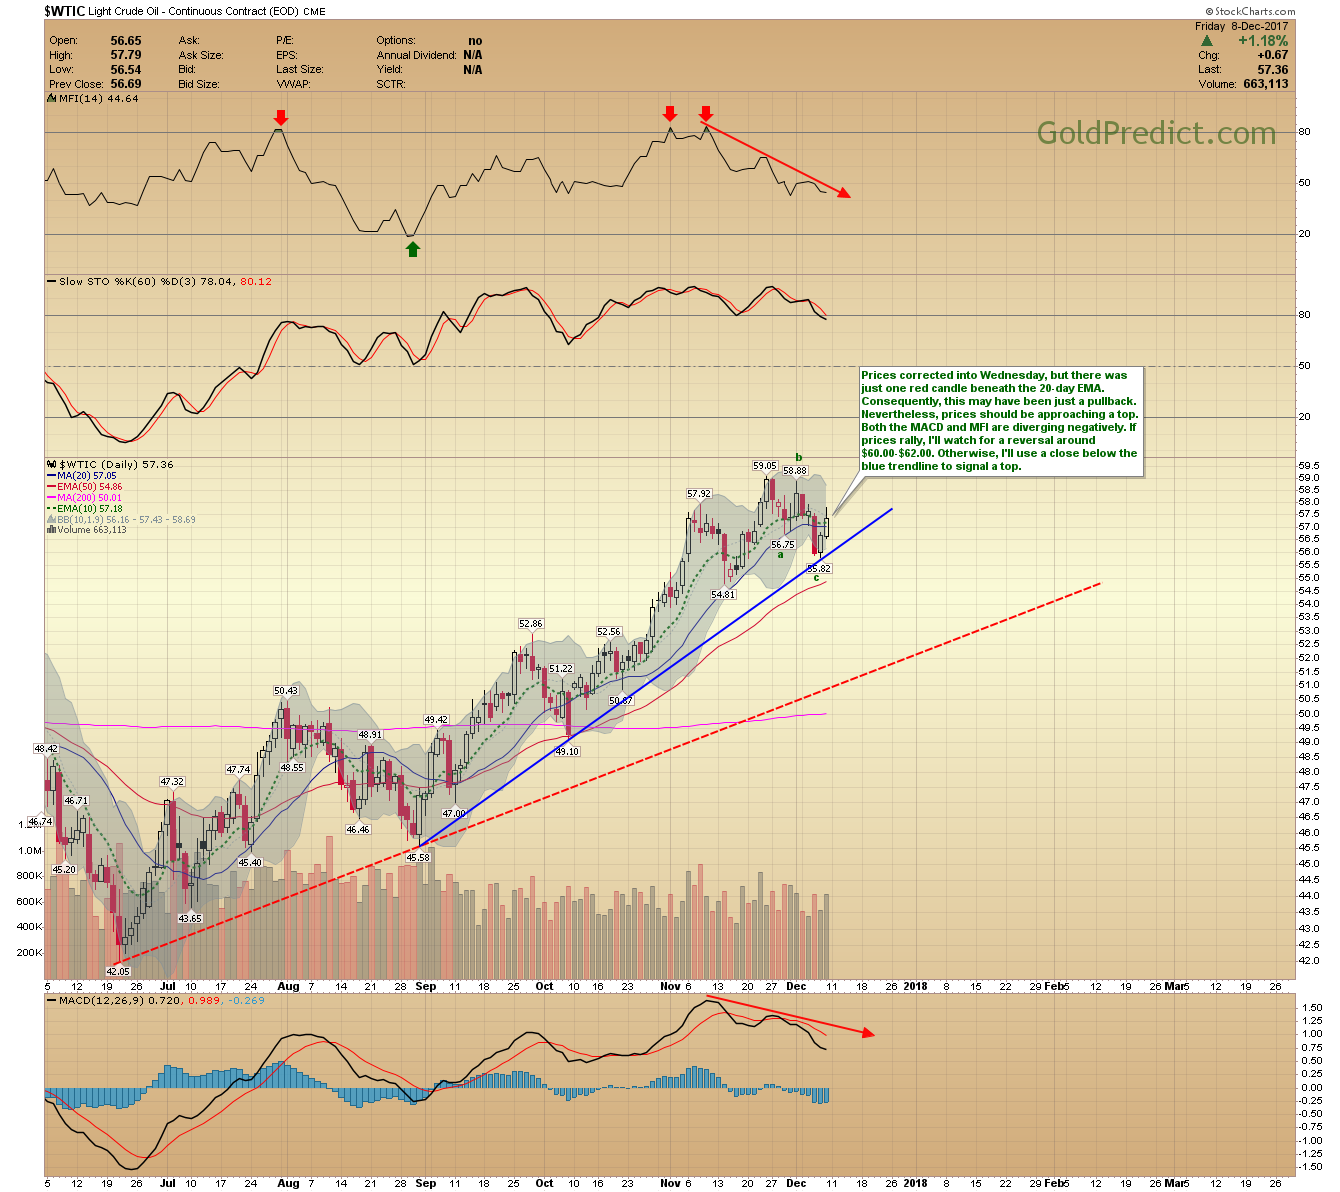
-WTIC- Prices corrected into Wednesday, but there was just one red candle beneath the 20-day EMA. Consequently, this may have been just a pullback. Nevertheless, prices should be approaching a top. Both the MACD and MFI are diverging negatively. If prices rally, I’ll watch for a reversal around $60.00-$62.00. Otherwise, I’ll use a close below the blue trendline to signal a top.
-ERX- Similar to oil, there was just one red candle close below the 20-day EMA. Prices could rally a bit more or swing back and forth in a consolidation pattern. Nonetheless, I may consider shorting energy stocks if we get a clear top in oil.

The 4-year basing pattern in gold is nearly complete, and prices should finally break above $1,400 next year. I’ll release our projects for 2018 and beyond next week.
Have a safe and pleasant weekend.