
We believe 2018 will be the breakout year for metals and miners. The initial bull market advance occurred in 2016. Miners exploded off their 2016 lows and needed 2017 to recover. The consolidation phase in nigh complete and they are positioned for the second advance.
Prices are close to a low: We may have seen a bottom during last weeks Fed announcement, or we could get one final decline. I prefer to wait for confirmation before entering leveraged trading positions. However, long-term investors may consider buying physical gold and silver at current levels. I changed the color codes to accommodate long-term holdings in physical metals.
Expect multiple updates next week. To support the final decline scenario, I’d like to see prices weaken by Tuesday or Wednesday. Gold needs to decline below $1,247 and silver below $15.85 to support this outlook.
-US DOLLAR- I see two possible scenarios for the dollar.
1) Closing below the November 92.43 low will confirm an intermediate cycle top and set up a breakdown below 90.99. If this transpires, then gold bottomed at $1,238.30.
2) The dollar rallies above the 94.21 high and tops at the 200-day MA in January. In this scenario, metals and miners would produce a final decline.

-GOLD WEEKLY- After peaking in 2011 gold entered a prolonged correction. Prices bottomed in 2015 when the FED increased rates for the first time since 2006. Gold rallied sharply in 2016 and 2017, but prices failed to produce an uptrend. A symmetrical basing pattern emerged, and gold is set to break higher in 2018.
We’ve been looking for a decline to the $1,200 level to complete the symmetrical basing pattern. However, prices may have bottomed prematurely at $1,238.30. See daily gold chart for details.

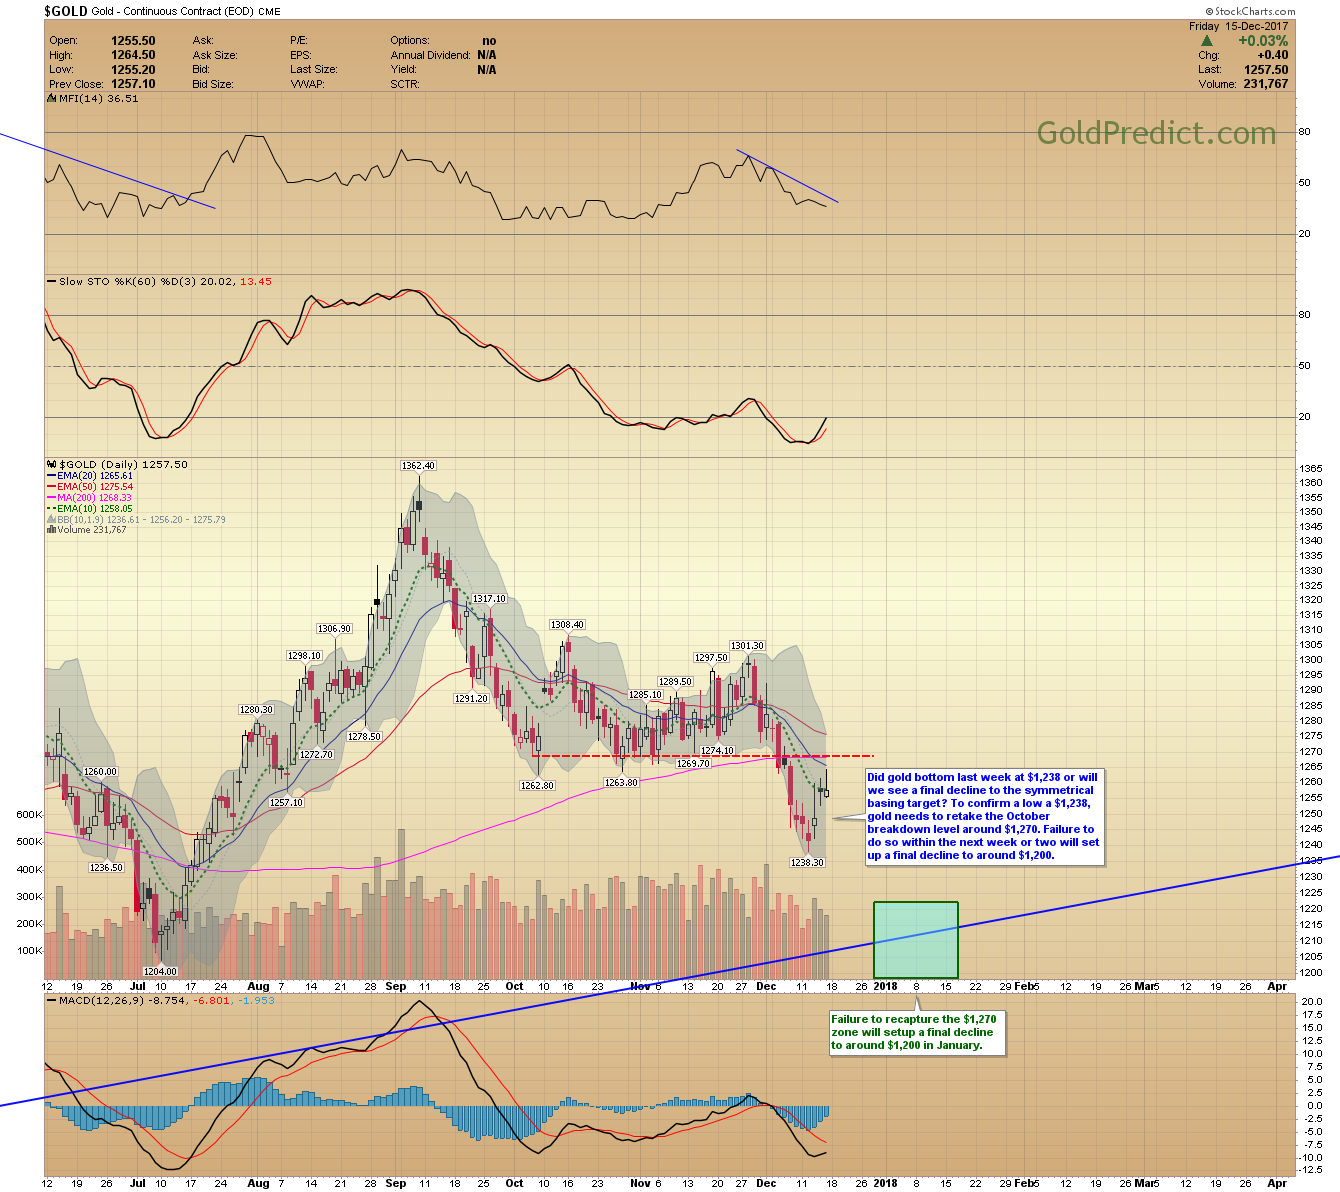
-GOLD DAILY- Did gold bottom last week at $1,238 or will we see a final decline to the symmetrical basing target? To confirm a low, gold needs to retake the October breakdown level around $1,270. Failure to do so within the next week or two will set up a final decline to around $1,200.
-SILVER WEEKLY- Silver and gold take turns leading a bull market. Silver outperformed gold in 2016, and then gold outshined silver in 2017. It’s time to pass the torch, and we expect a dominant run in silver in 2018.

-SILVER DAILY- Prices may have bottomed at $15.64, but the price structure could easily accommodate a 5th and final wave to complete the larger ABC correction. Nevertheless, prices closed above the 10-day EMA on Friday, and I may consider a partial position if we get a white candle close above $16.20.

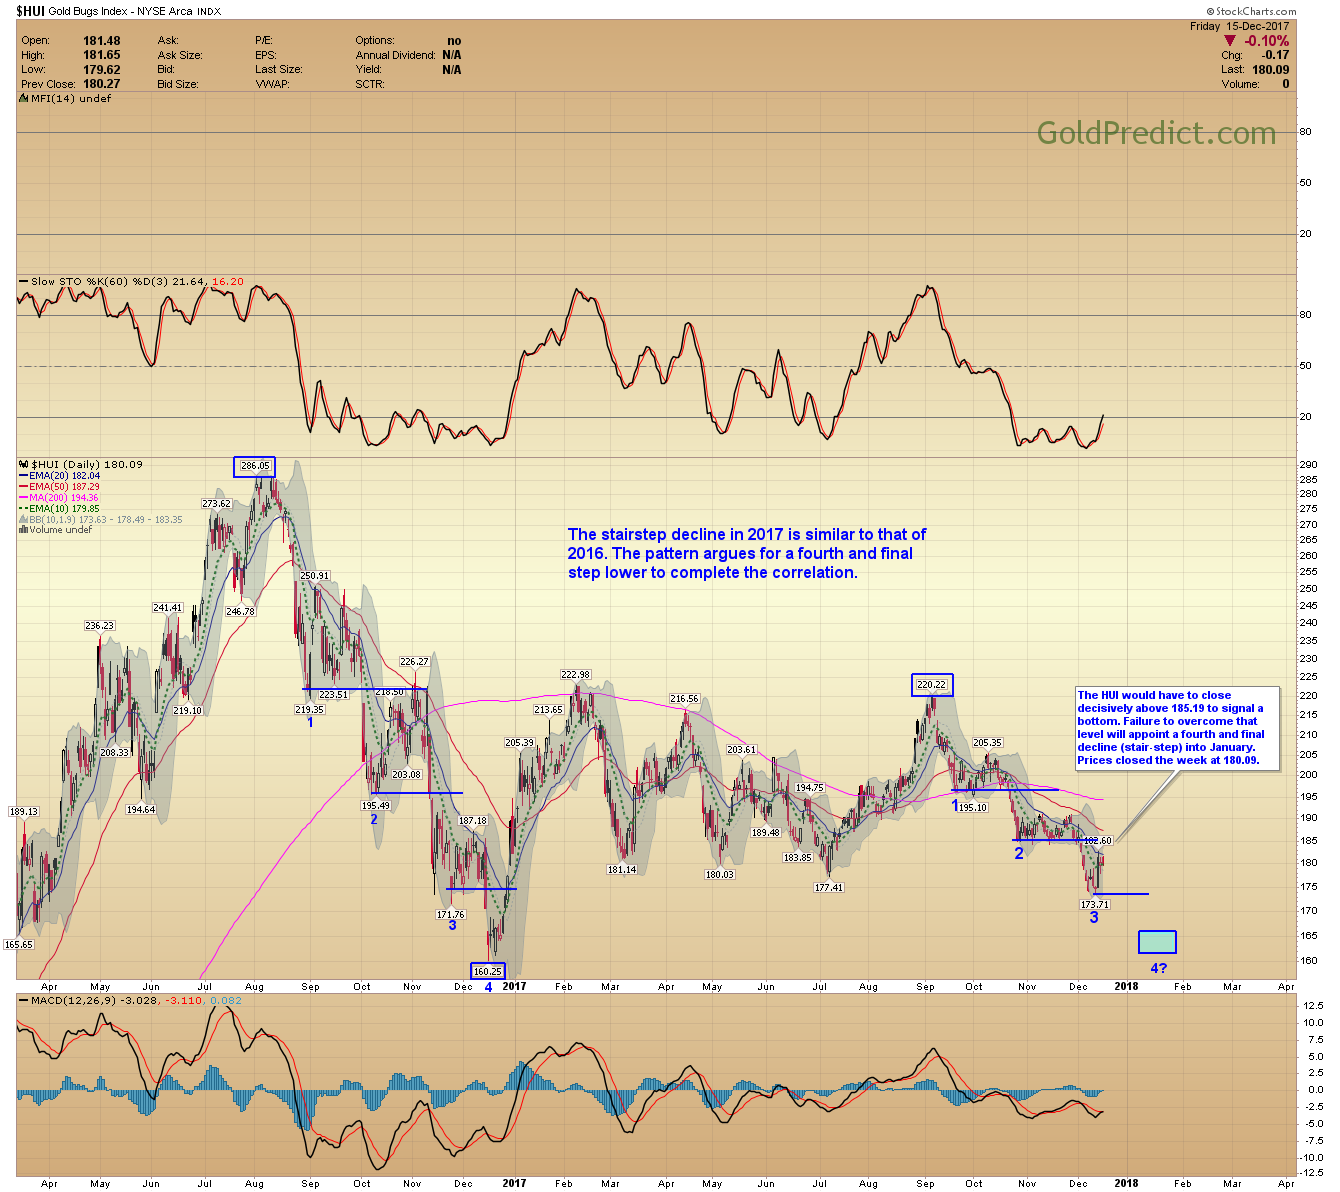
-HUI STAIRSTEP CHART- The stairstep decline in 2017 is similar to that of 2016. The pattern argues for a fourth and final step lower to complete the correlation. The HUI would have to close decisively above 185.19 to signal a bottom. Failure to overcome that level will appoint a fourth and final decline (stair-step) into January. Prices closed the week at 180.09.
-GDX- Consecutive closes above $22.40 would indicate a bottom in miners. Failing to recapture $22.40 and dropping below $21.74 will set up a fourth and final decline.

-GDXJ- Juniors are a bit more volatile than GDX. A white candle close above $31.87 (Fed day high) would indicate a bottom. However, dropping below $30.94 would support a final decline.

-SPY- Prices immediately reversed the swing high and rallied on increased volume. Stocks should remain strong into year-end. Investors will likely take profit and reposition their portfolios in January.

-WTIC- Prices could be forming a rounded top. Dropping below last weeks $56.09 low could expedite selling. If established, a correction to the 200-day MA ($50.00) will become likely.

Have a safe and pleasant weekend.
Note: Bitcoin is about to hit $20,000. That is the next logical point for a selling event. I’ll watch and see how prices react at that level.