
The 2018 price pattern in gold continues to mimic the 2016 Q3/Q4 model. The 2018 design has taken more time, but prices have hit the relevant benchmarks. Virtually everyone is bearish on gold and looking for a decline to $1050 and lower. We heard the same calls back in December 2016. Maybe the bears are right this time, and gold is dead, but what if they’re wrong?
After bottoming in December 2016, gold rallied and ultimately tested the critical $1370 breakout point the following year. In December 2016 the COT was neutral, at best, with commercials net short -149,866 contracts. Speculators were net long +129,311. Fast forward to today – Commercials are now net short just -7,350 contracts and speculators shifted from net long to net short (-3,688 contracts) for the first time since 2001. The current COT setup is much more bullish than it was in December 2016.
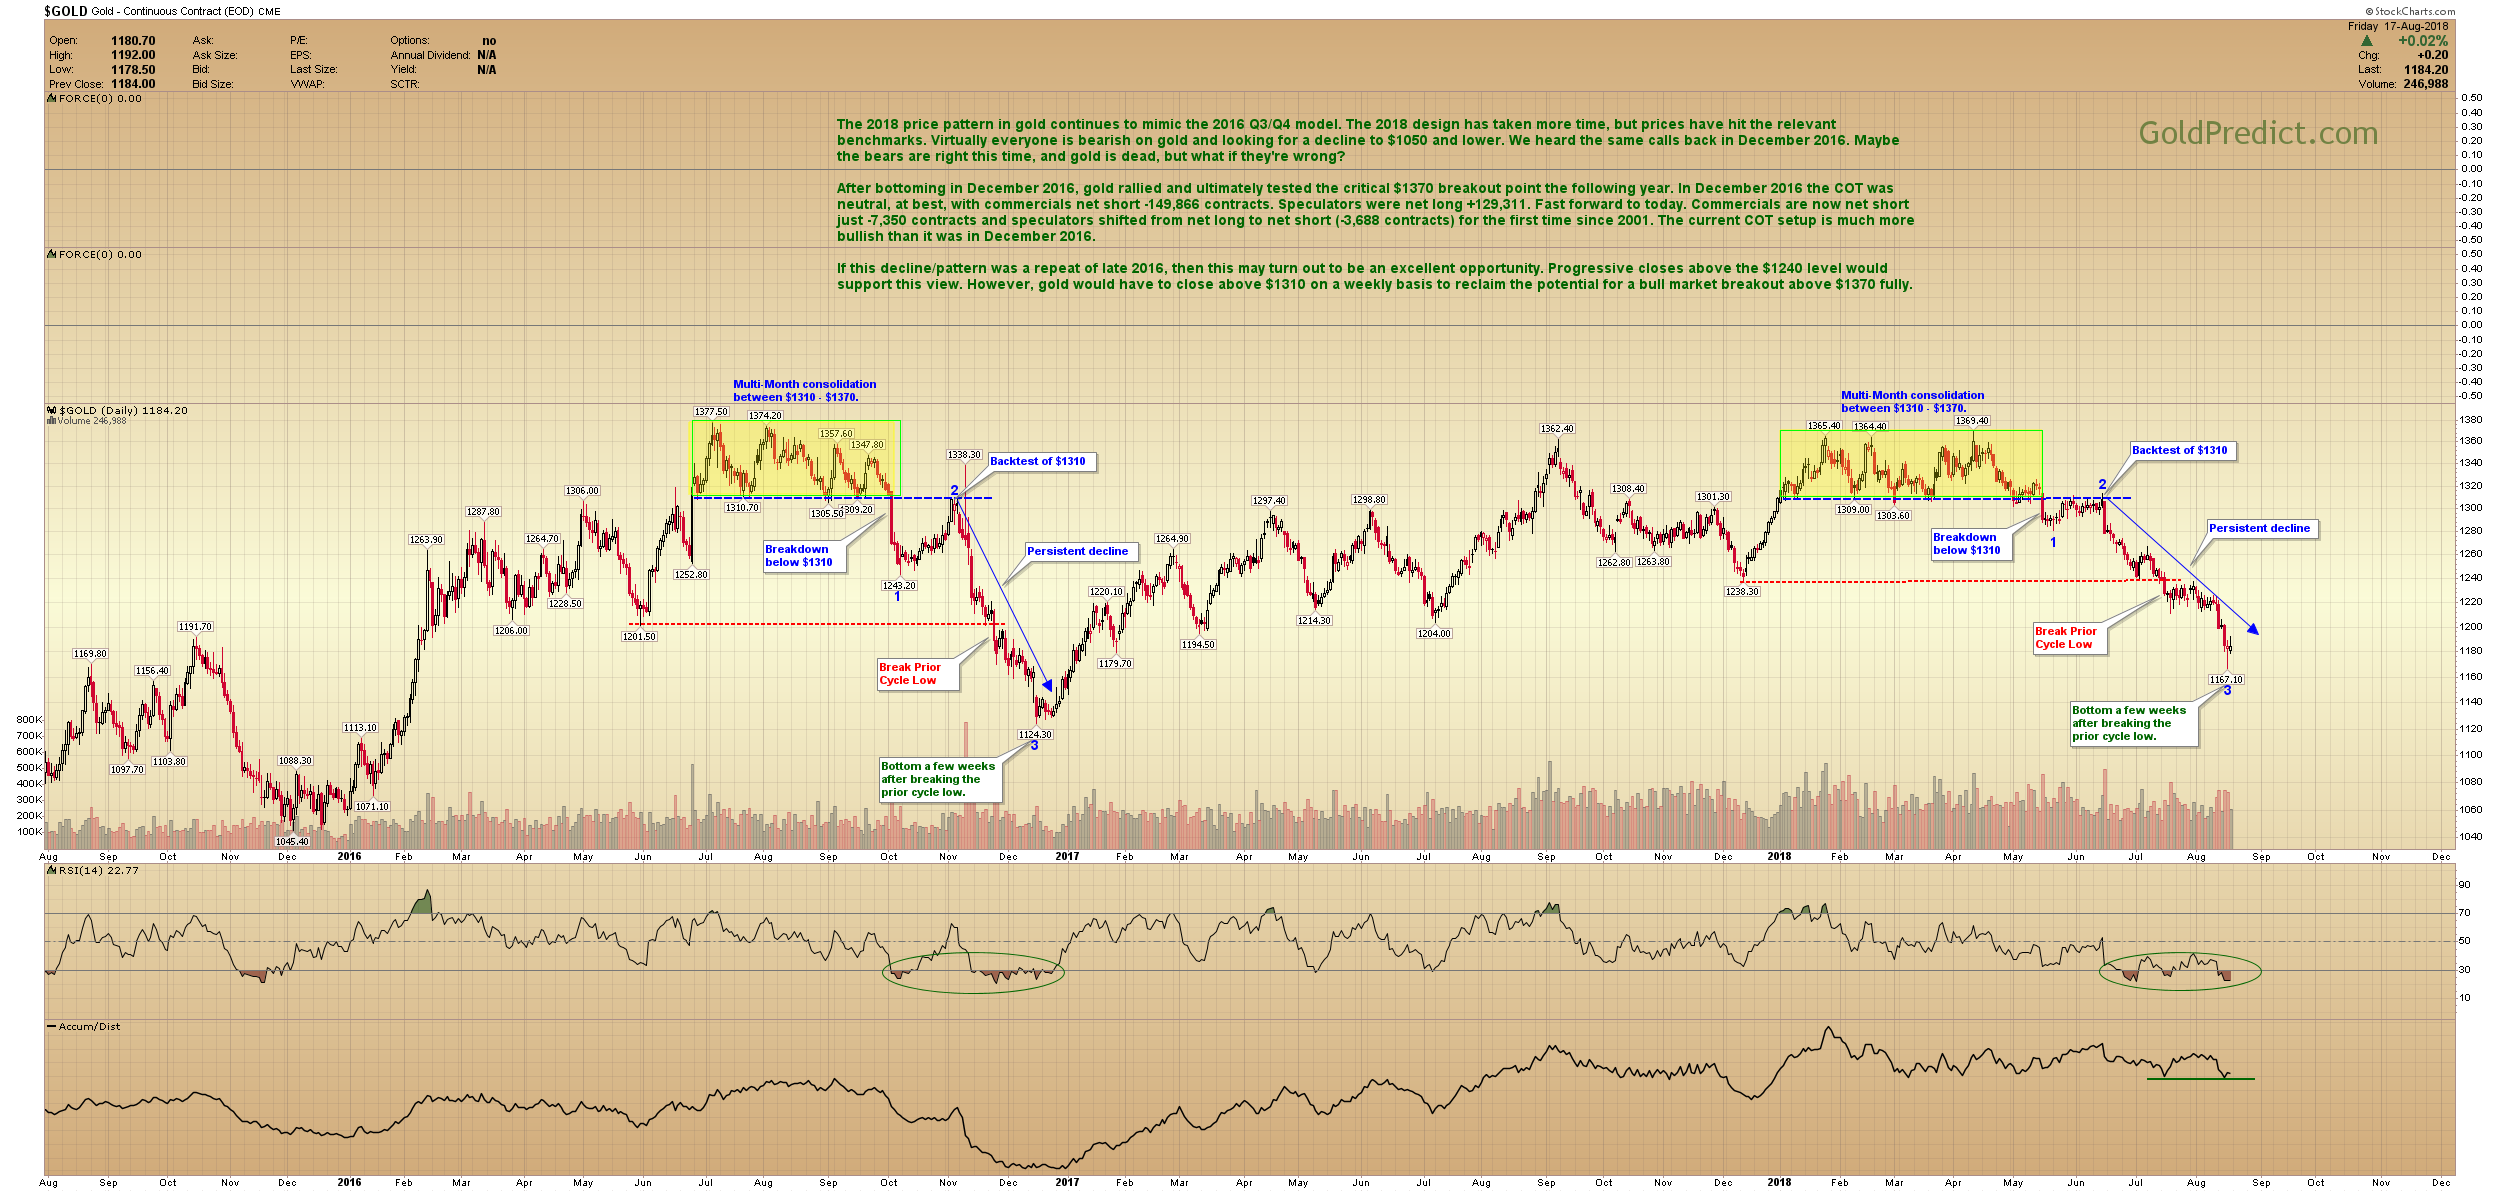
If this decline/pattern was a repeat of late 2016, then this may turn out to be an excellent opportunity. Progressive closes above the $1240 level would support this view. However, gold would have to close above $1310 on a weekly basis to reclaim the potential for a bull market breakout above $1370 fully.