
Gold is at a pivotal point. Prices dropped $200 since April’s botched breakout attempt. We have a failed cycle and prices collapsed below support at $1200. The moving averages are down and trending lower. The charts – well are frankly bearish. Gold needs to mount a miraculous turnaround to revive the bullish potential.
Factors Supporting A Miraculous Reversal
- Constructive COT positioning- The commitment of traders is about as bullish as I’ve seen it in 17-years.
- Record shorting- At some point managed money, and large speculators have to buy and cover.
- The 2016/2018 correlation pattern in gold looks complete.
- Sentiment- The investing majority are firmly on the bearish side of the boat.
- Seasonality- Typically prices bottom in summer (June – August) and rally into the fall (September – November). Click here.
- Currencies – The Dollar: After a 6-Month rally, prices halted at the 50% retracement in time and price. The Euro found support and likely bottomed at its 200-week MA.
The stage is set, and it looks like gold formed a bottom (possibly major) at $1,167. The price action over the next 4-8 weeks will confirm. The critical level to overcome is $1310. Above that and a breakout above $1370 becomes expected. However, a sustained decline below the $1124 support zone would harden the bearish evidence.
-US DOLLAR WEEKLY- The Dollar formed a bearish evening star candle pattern and closed back below the 200-week MA. The 2018 rebound retraced approximately 50% of the 2017 decline in both time and price. Technically, the advance from February to August meets the requirements for a bear market rebound and backtest of the 200-week MA. The Dollar would have to close below the long-term red trendline in the coming months to confirm this scenario. A weekly close above 96.86 would imply more dollar strength and lower gold prices.

-US DOLLAR DAILY- The dollar is 50-days into a cycle that usually averages 54-60 trading days between lows. Prices should drop a bit further and bottom within the next 1-2 weeks. From there, I think prices will rally for 2-3 weeks, top (maybe near the September rate hike) and then decline into November.

-EURO WEEKLY- The Euro reversed at the 200-week MA, formed a weekly swing low and closed back above the 115.58 breakdown level. Prices formed (at least) a short-term bottom. However, they would have to rally and close above the green trendline in the coming months to establish a breakout.

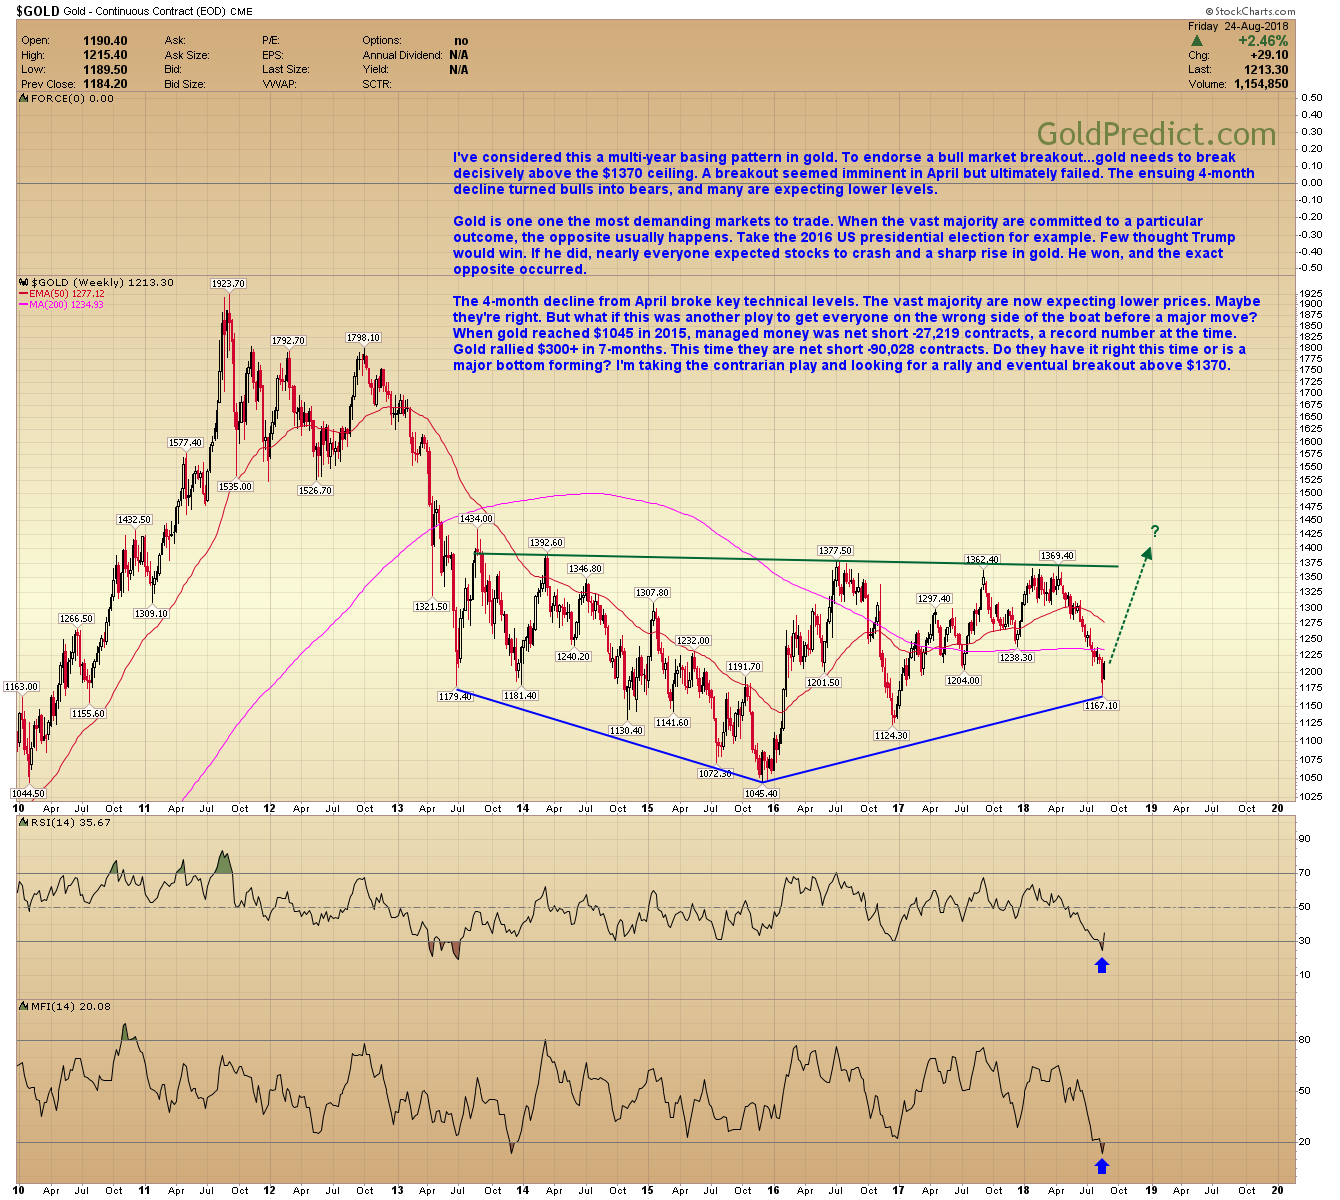
-GOLD WEEKLY- I’ve considered this a multi-year basing pattern in gold. To endorse a bull market breakout…gold needs to break decisively above the $1370 ceiling. A breakout seemed imminent in April but ultimately failed. The ensuing 4-month decline turned bulls into bears, and many are expecting lower levels.
Gold is one one the most demanding markets to trade. When the vast majority are committed to a particular outcome, the opposite usually happens. Take the 2016 US presidential election for example. Few thought Trump would win. If he did, nearly everyone expected stocks to crash and a sharp rise in gold. He won, and the exact opposite occurred.
The 4-month decline from April broke key technical levels. The vast majority are now expecting lower prices. Maybe they’re right. But what if this was another ploy to get everyone on the wrong side of the boat before a major move? When gold reached $1045 in 2015, managed money was net short -27,219 contracts, a record number at the time. Gold rallied $300+ in 7-months. This time they are net short -90,028 contracts. Do they have it right this time or is a major bottom forming? I’m taking the contrarian play and looking for a rally and eventual breakout above $1370.
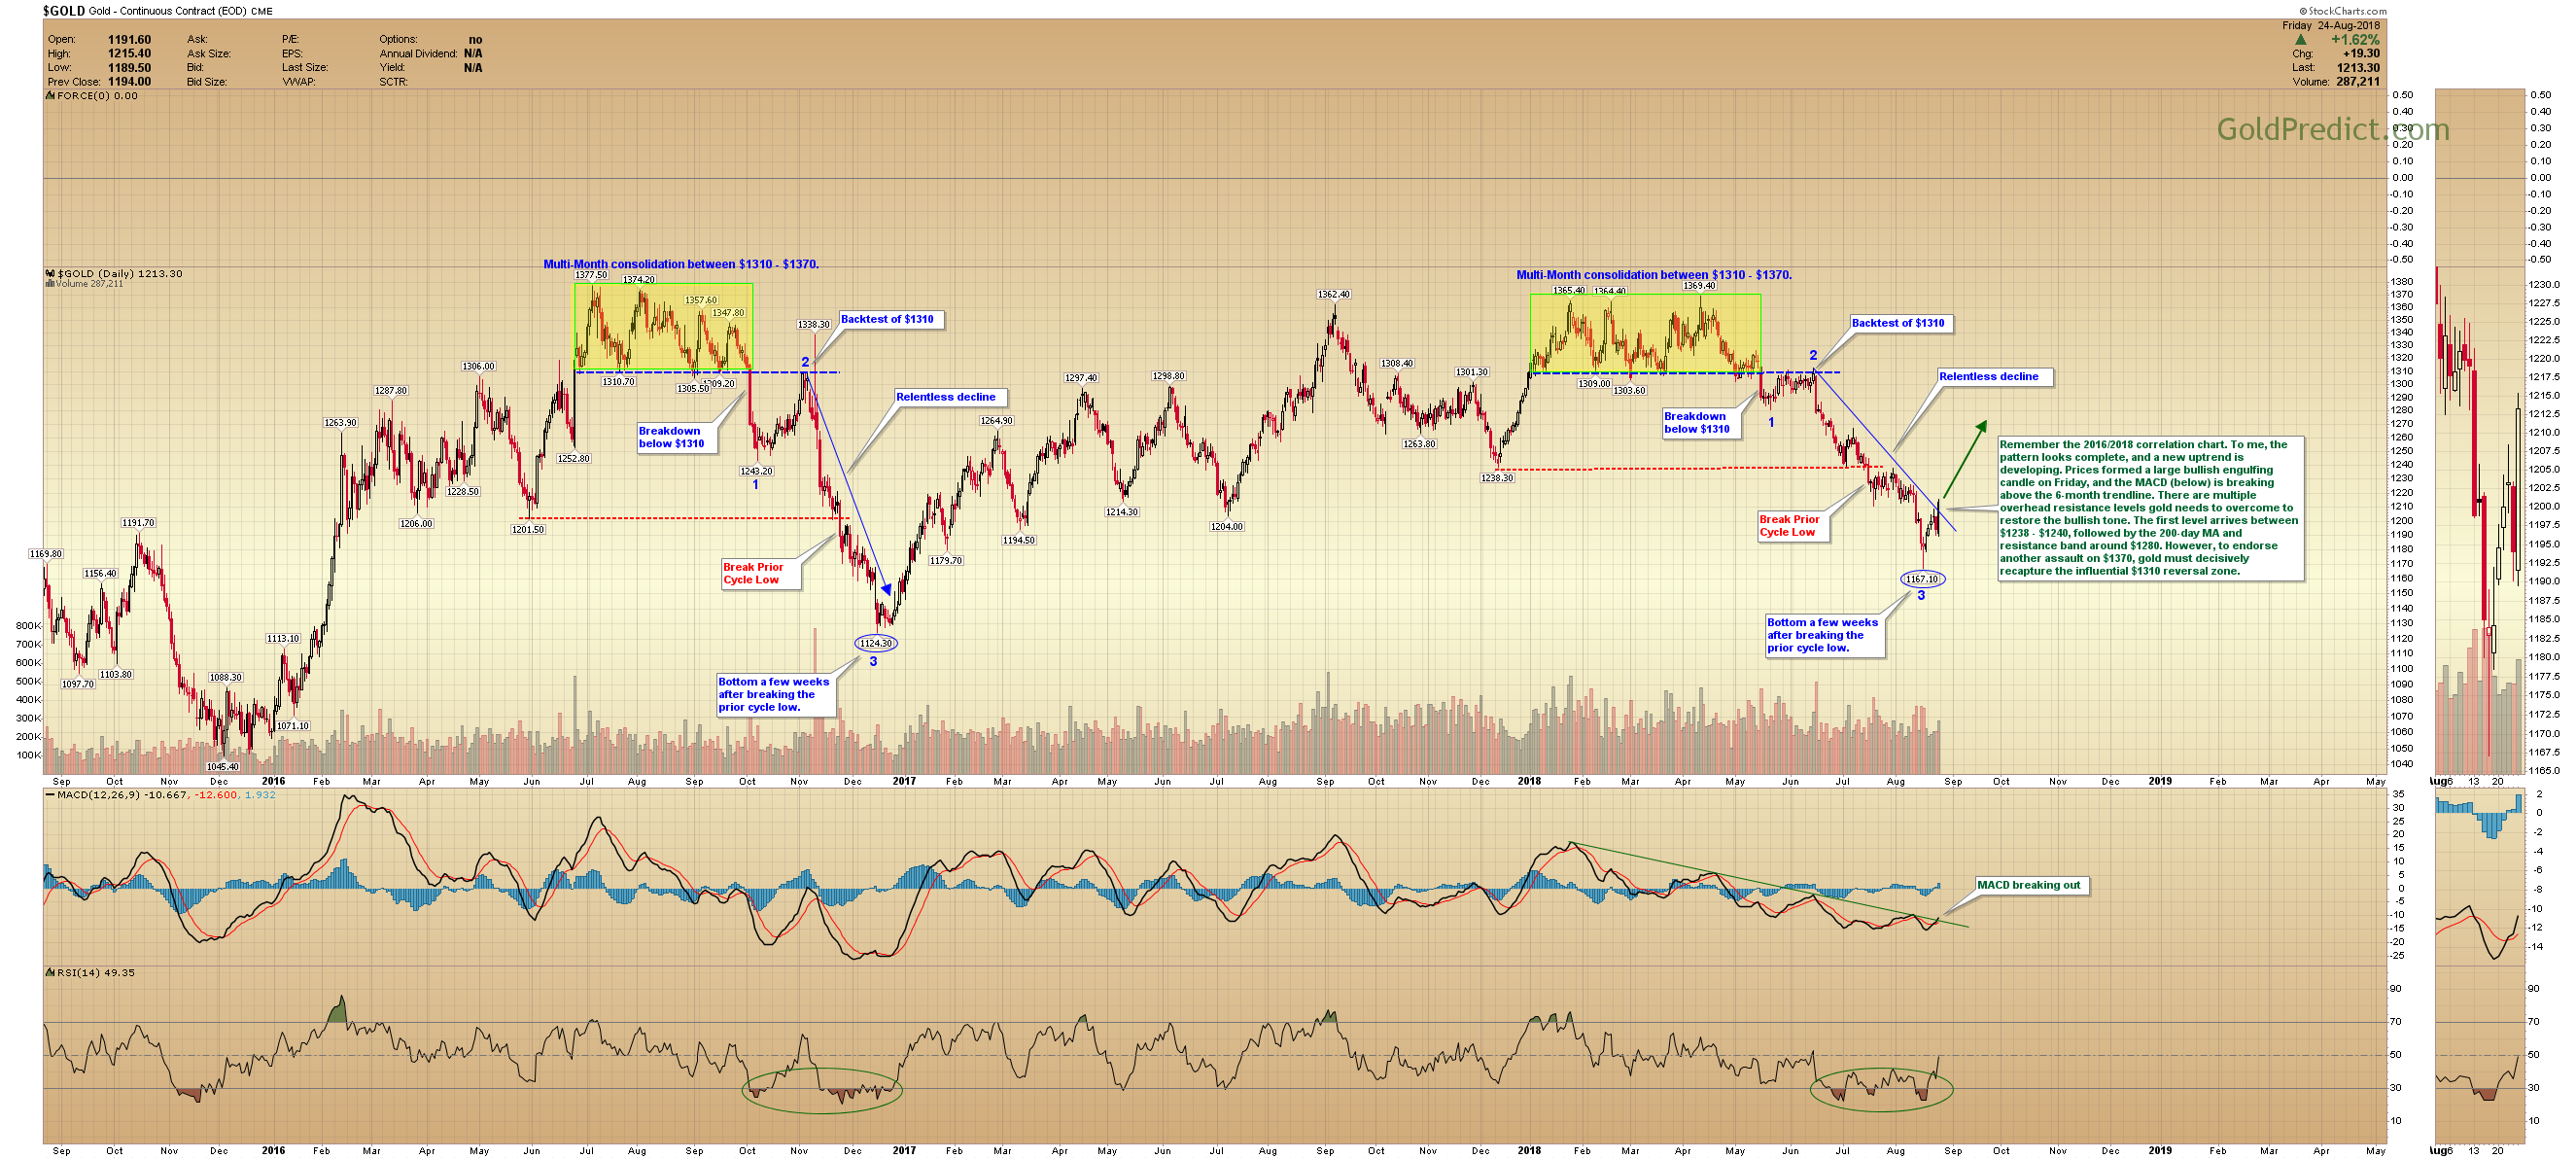
-GOLD DAILY- Remember the 2016/2018 correlation chart. To me, the pattern looks complete, and a new uptrend is developing. Prices formed a large bullish engulfing candle on Friday, and the MACD (below) is breaking above the 6-month trendline. There are multiple overhead resistance levels gold needs to overcome to restore the bullish tone. The first level arrives between $1238 – $1240, followed by the 200-day MA and resistance band around $1280. However, to endorse another assault on $1370, gold must decisively recapture the influential $1310 reversal zone.
-SILVER WEEKLY- After an incredibly rare 10-consecutive down weeks prices finally closed higher. Perhaps this is a double bottom. To establish a new bull market advance, silver would have to close progressively above the blue trendline on a weekly basis. A weekly close below $14.31 will set up a retest of the $13.65 bottom.

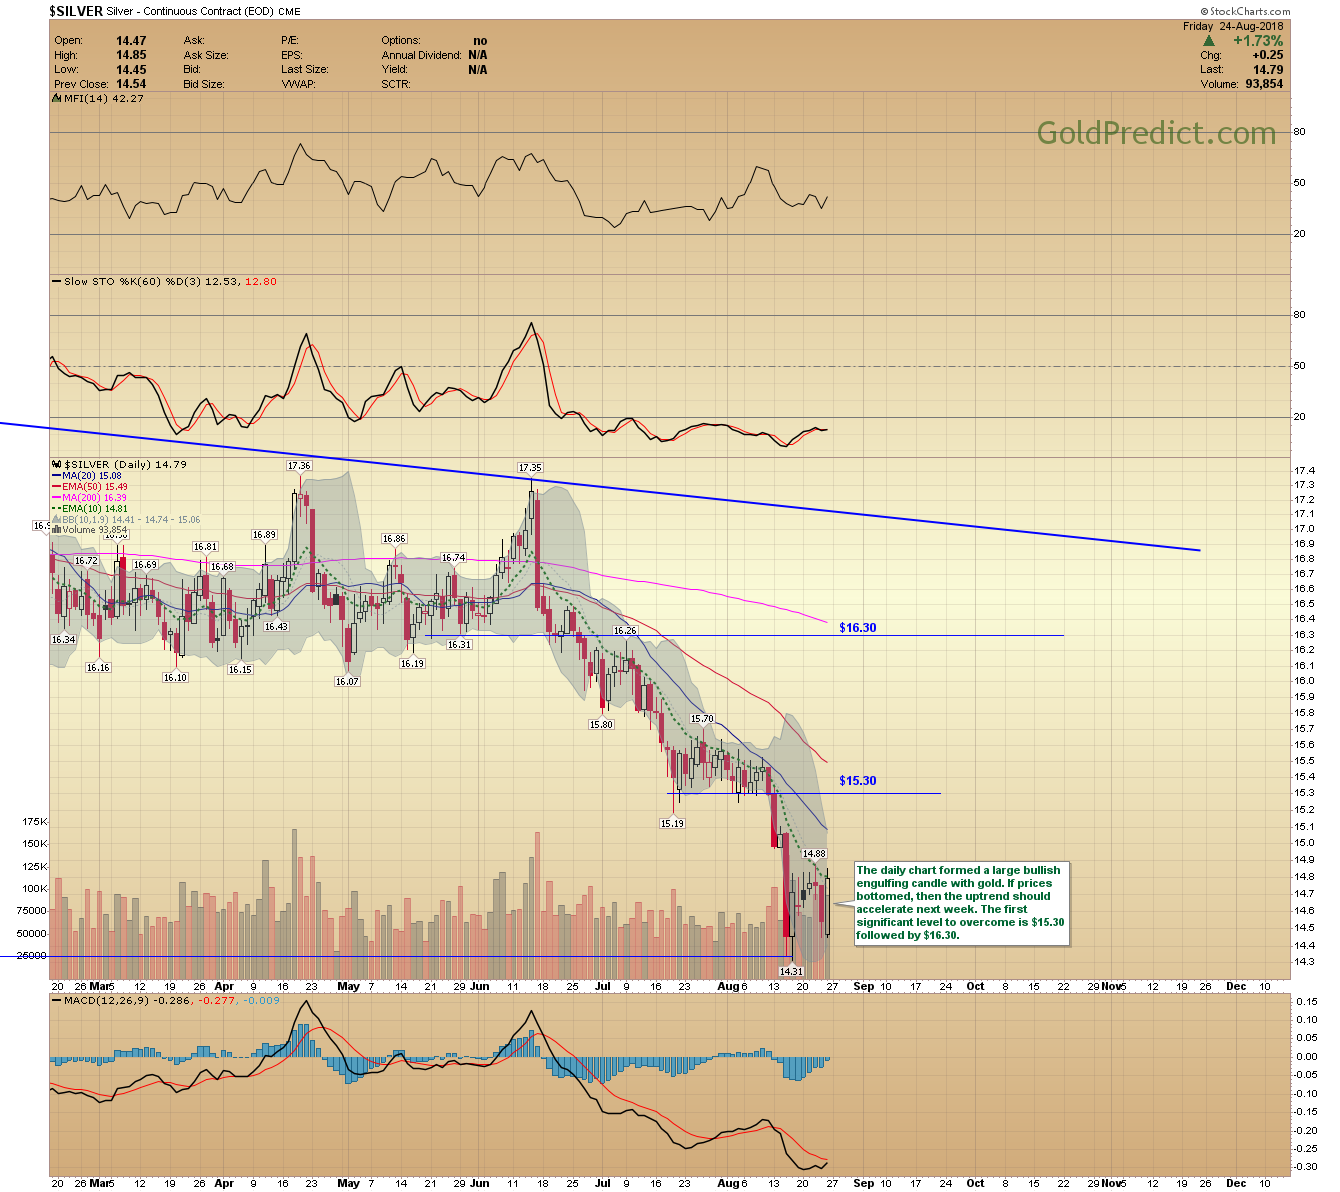
-SILVER DAILY- The daily chart formed a large bullish engulfing candle with gold. If prices bottomed, then the uptrend should accelerate next week. The first significant level to overcome is $15.30 followed by $16.30.
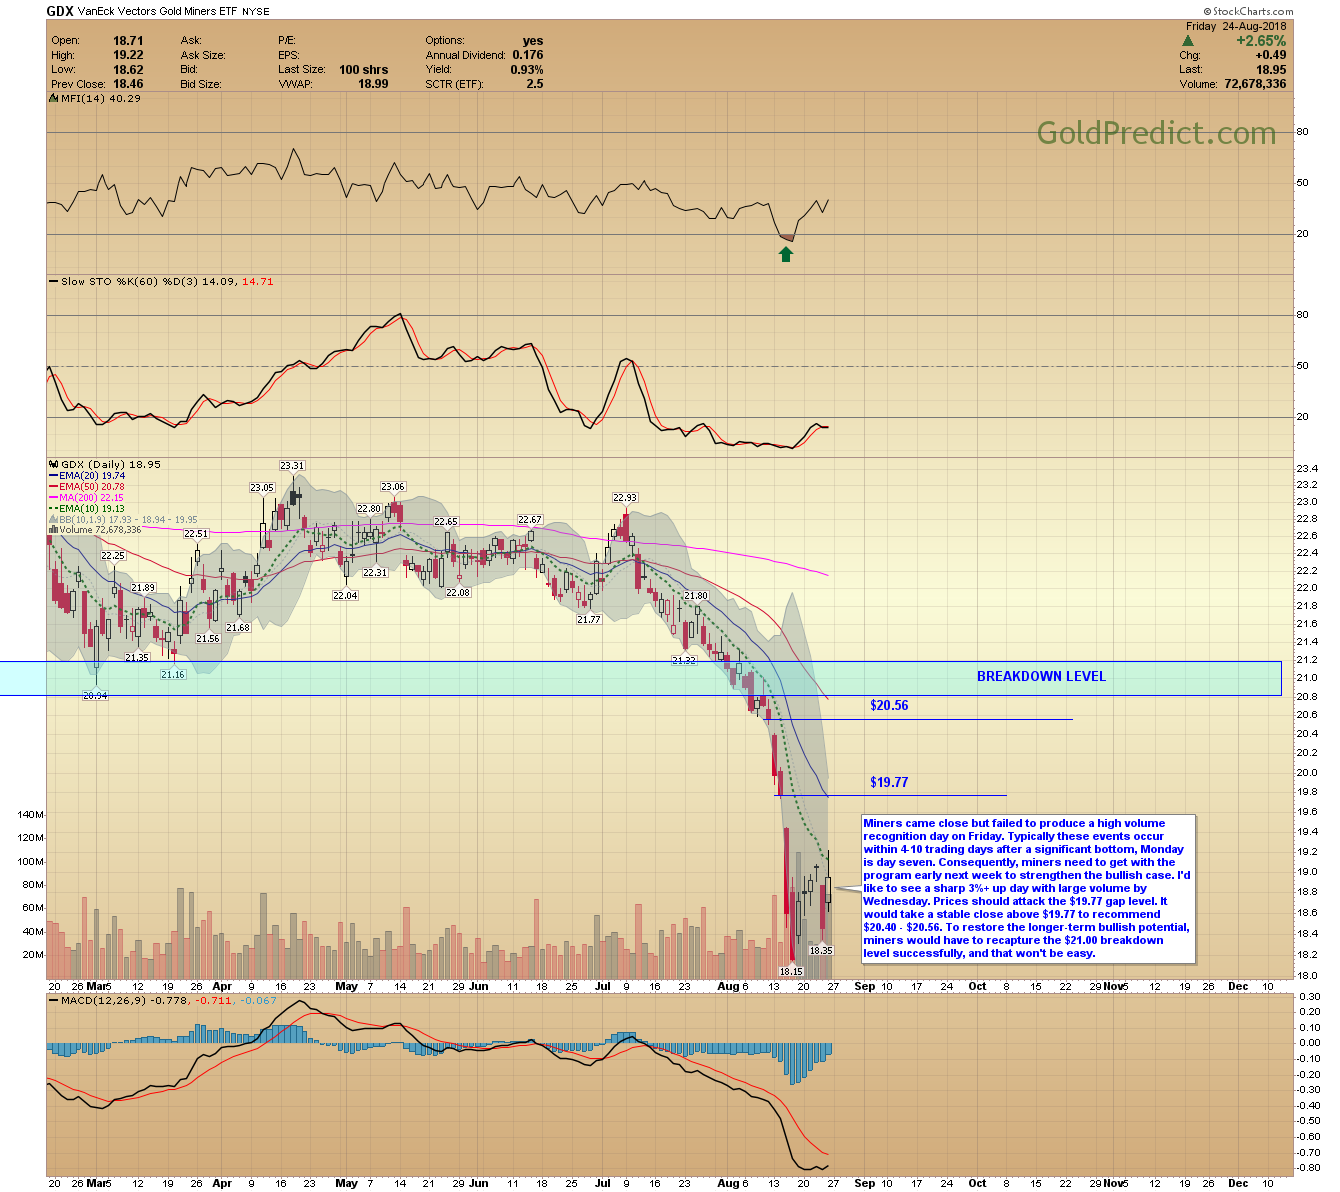
-GDX- Miners came close but failed to produce a high volume recognition day on Friday. Typically these events occur within 4-10 trading days after a significant bottom, Monday is day seven. Consequently, miners need to get with the program early next week to strengthen the bullish case. I’d like to see a sharp 3%+ up day with large volume by Wednesday. Prices should attack the $19.77 gap level. It would take a stable close above $19.77 to recommend $20.40 – $20.56. To restore the longer-term bullish potential, miners would have to recapture the $21.00 breakdown level successfully, and that won’t be easy.
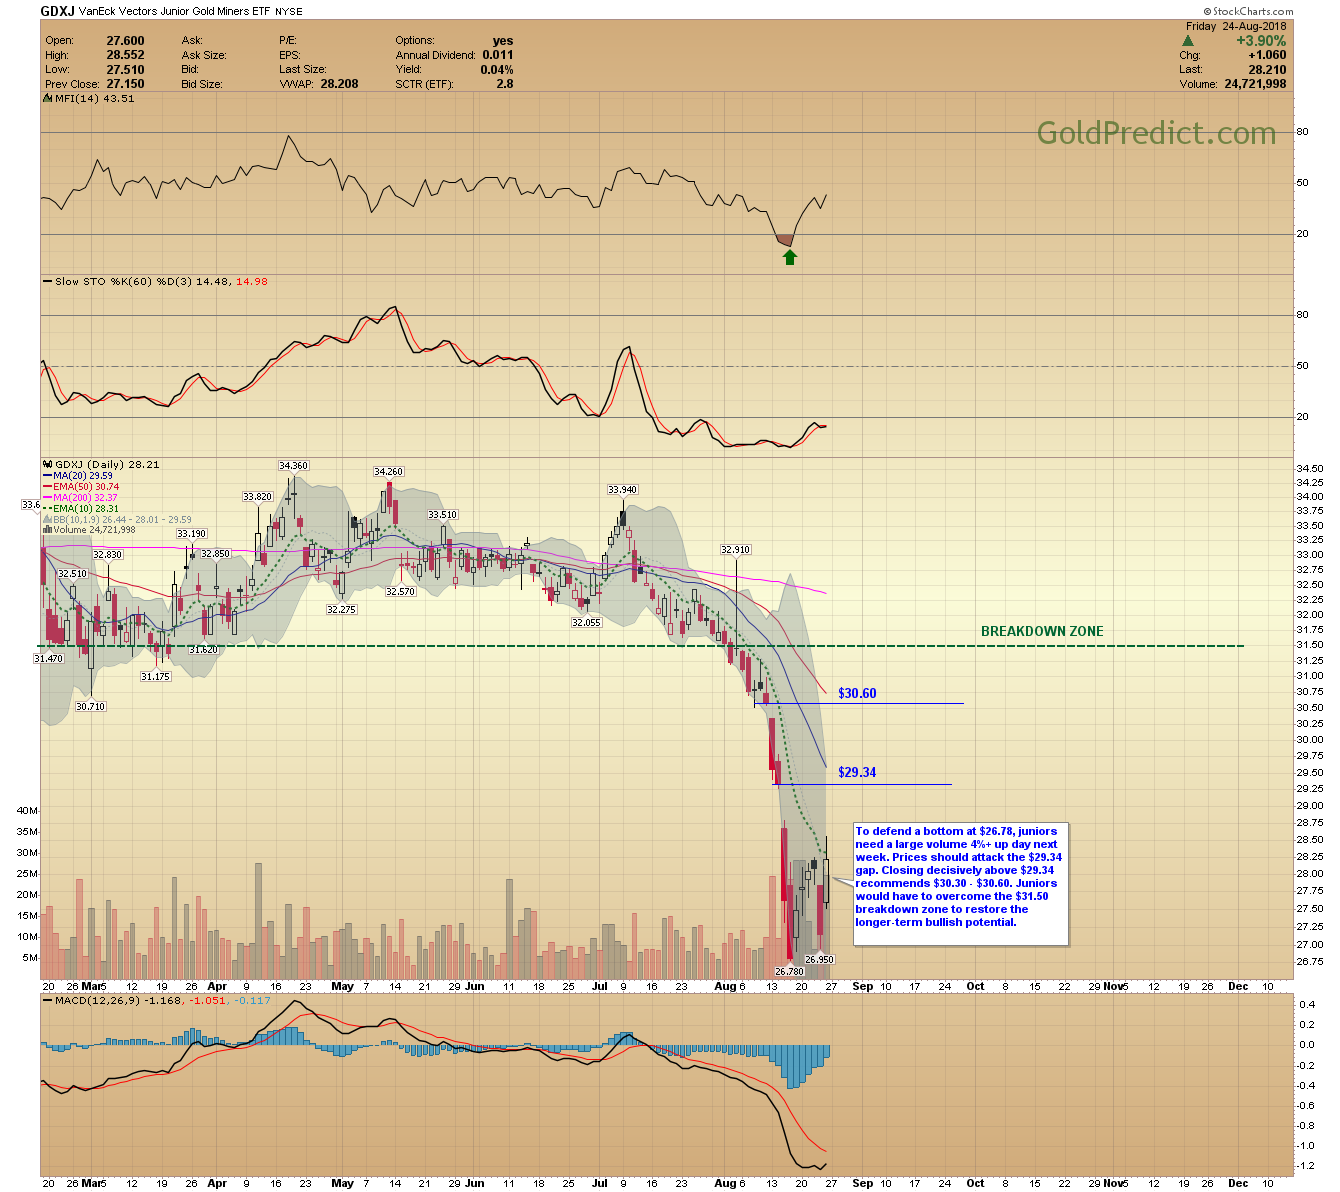
-GDXJ- To defend a bottom at $26.78, juniors need a large volume 4%+ up day next week. Prices should attack the $29.34 gap. Closing decisively above $29.34 recommends $30.30 – $30.60. Juniors would have to overcome the $31.50 breakdown zone to restore the longer-term bullish potential.
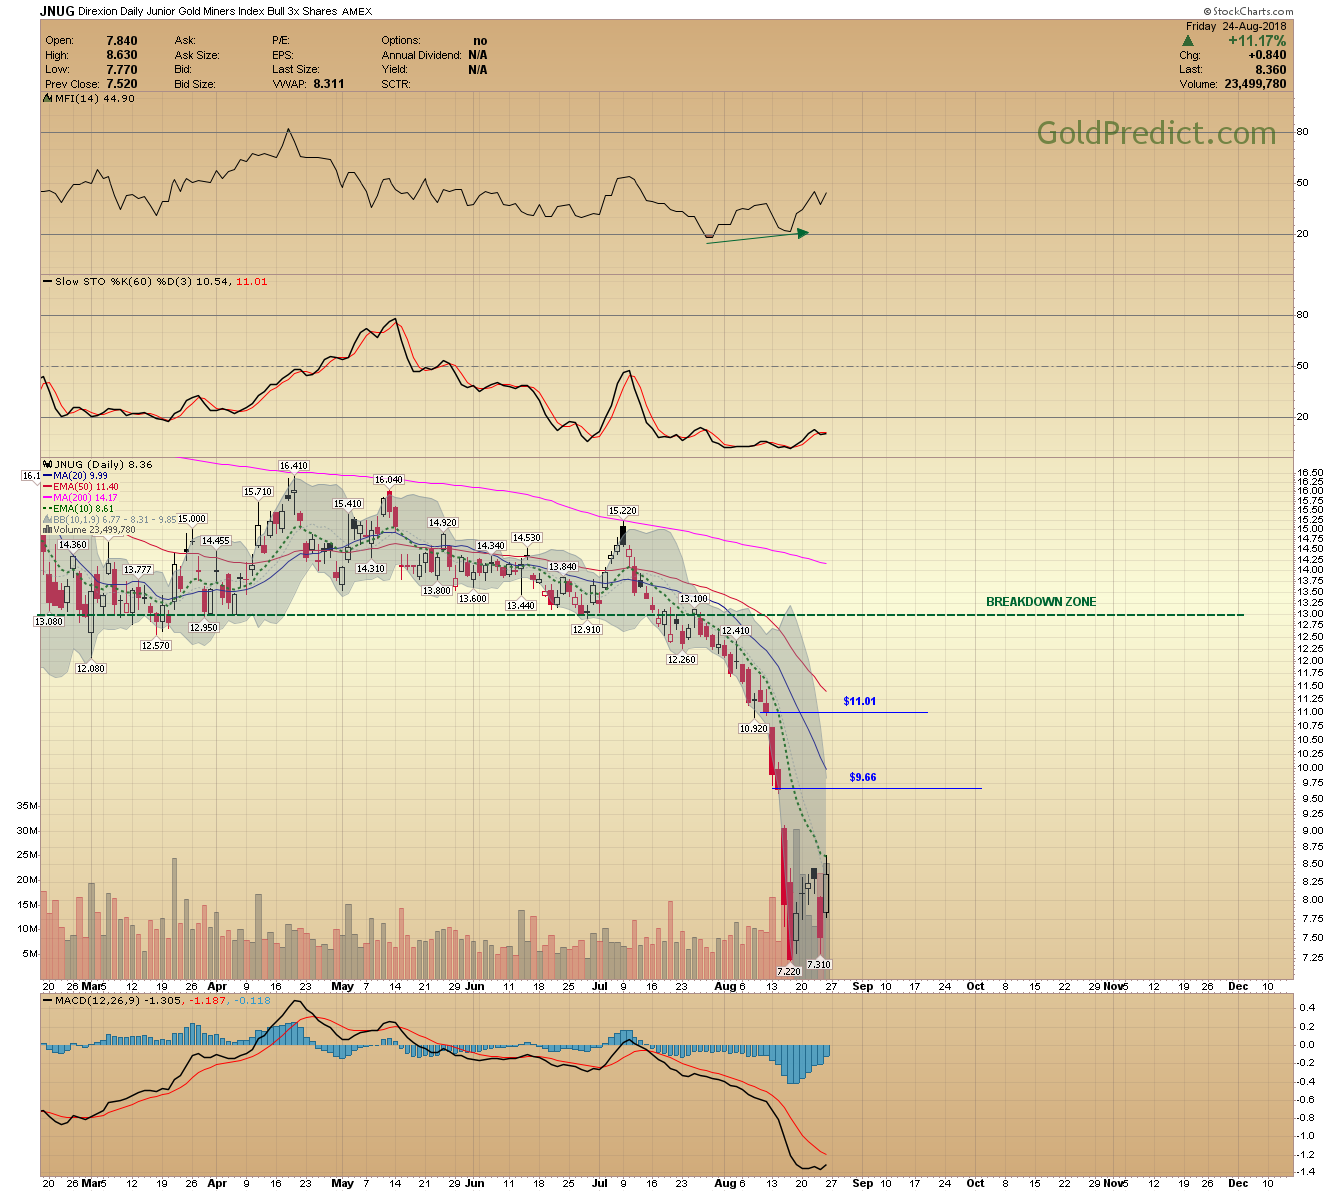
-JNUG- The levels for JNUG.
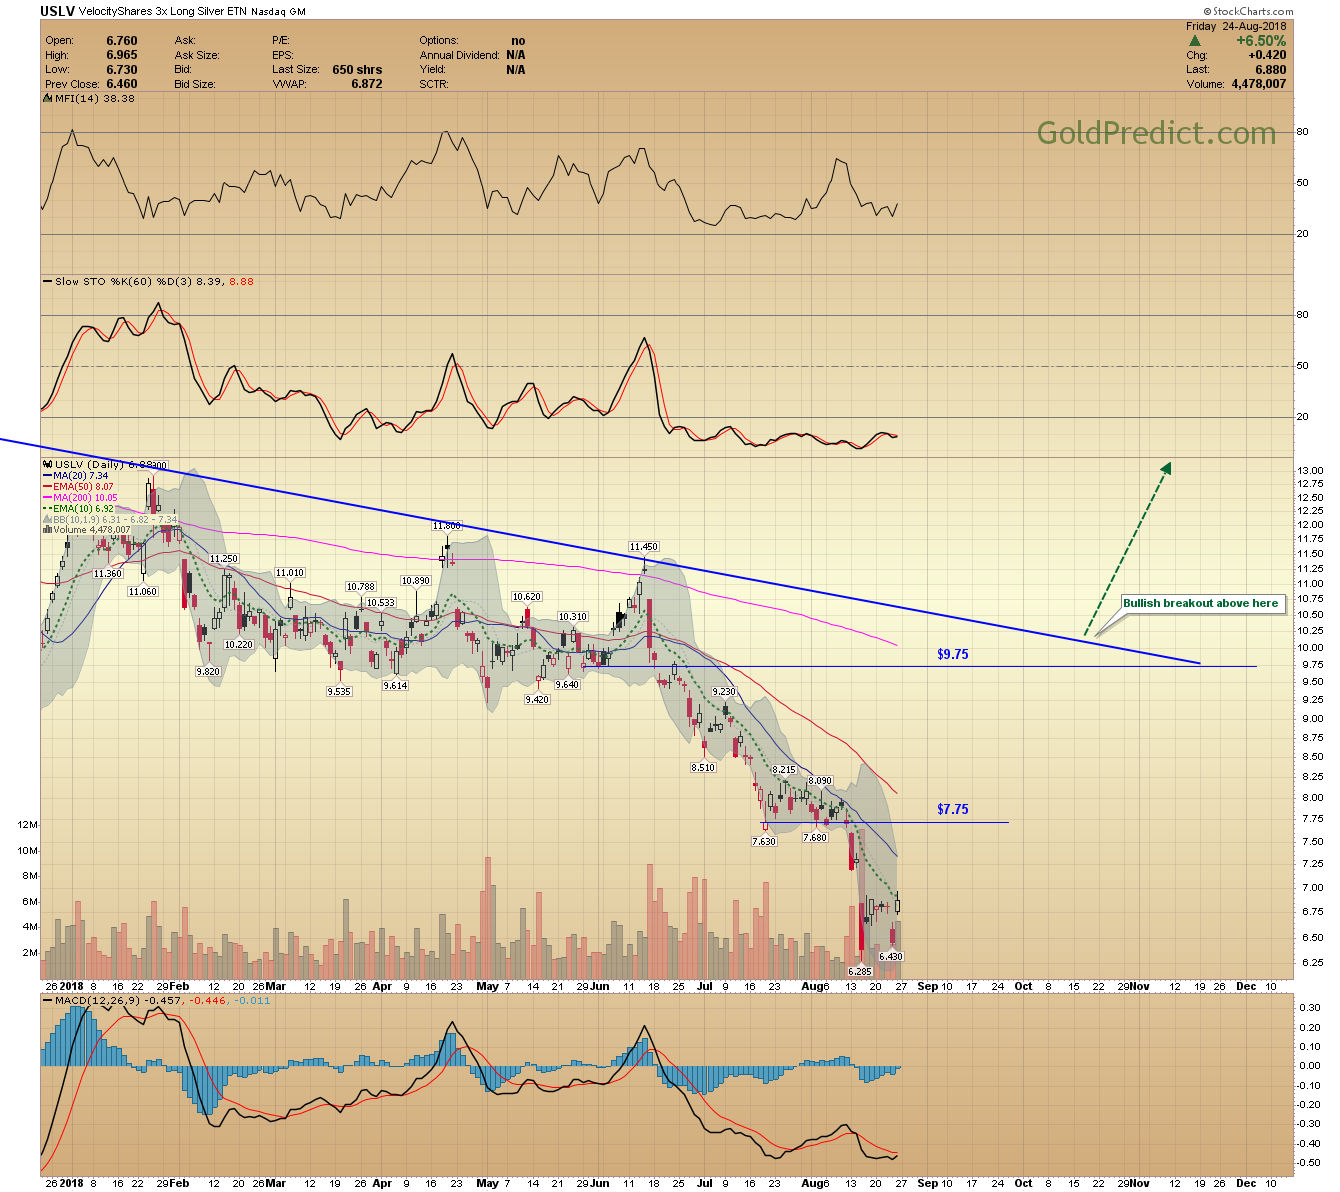
-USLV- The levels for USLV.
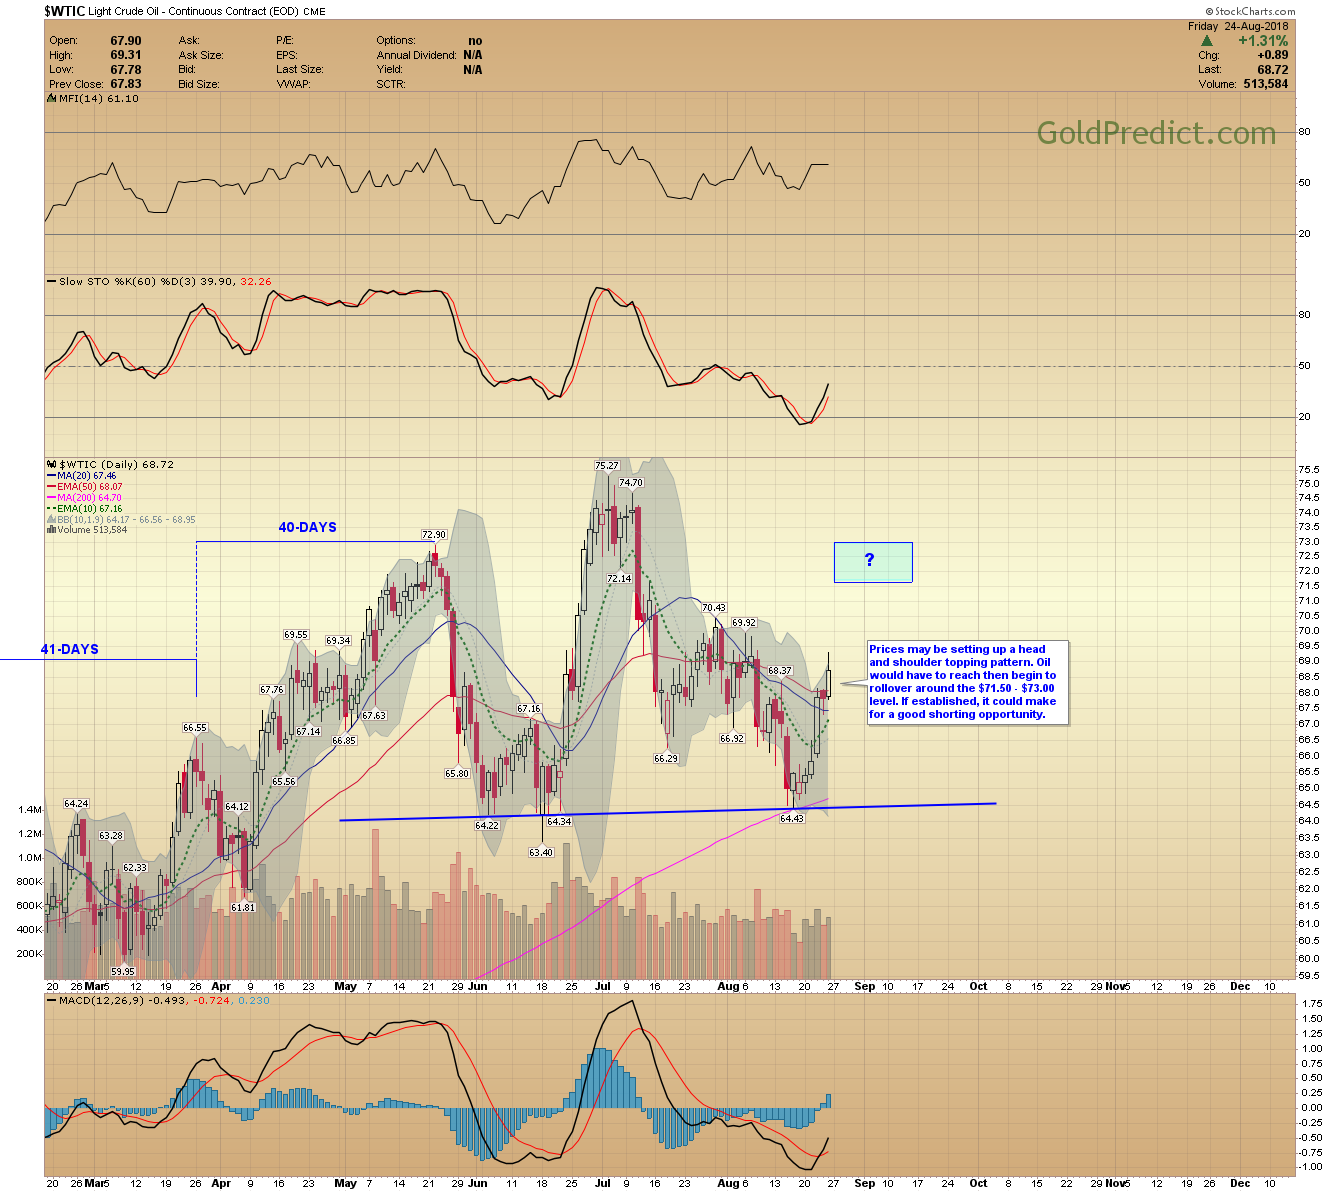
-WTIC- Prices may be setting up a head and shoulder topping pattern. Oil would have to reach…then begin to rollover around the $71.50 – $73.00 level. If established, it could make for a good shorting opportunity.
Expect multiple updates next week as the action unfolds.
Have a safe and pleasant weekend.