
To know where we are in the markets, first, we need to understand where we are in the broader economic landscape. The US stock market is weaker than I anticipated going into year-end. I felt stocks would reach new highs after an October slump. Instead, they have fallen to new lows. Bearishness abounds, and virtually every analyst I come across is proclaiming a bear market. Are they correct? I don’t think so, but each tick lower brings a little more anxiety with it.
As I said before, many of the bear market pieces are missing. The typical elements that provoke a recession aren’t lined up, and that’s why I continue to look for a bottom. Below I’ll review some economic indicators that I think support my “just a correction” hypothesis. The following charts are courtesy of Financial Sense Wealth Managment.
Net Percentage of Domestic Banks Tightening Standards for Commercial and Industrial Loans- Both large and small are currently below zero. These have to rise above 20 before we can consider recession type scenarios.

ISM Manufacturing- Currently around 60, would have to crash below 50 to reach recession territory.

Financial Stress Composite- Currently sits at a very healthy at 0.65. This number would have to dip into the red (negative territory) to meet standard recession benchmarks.
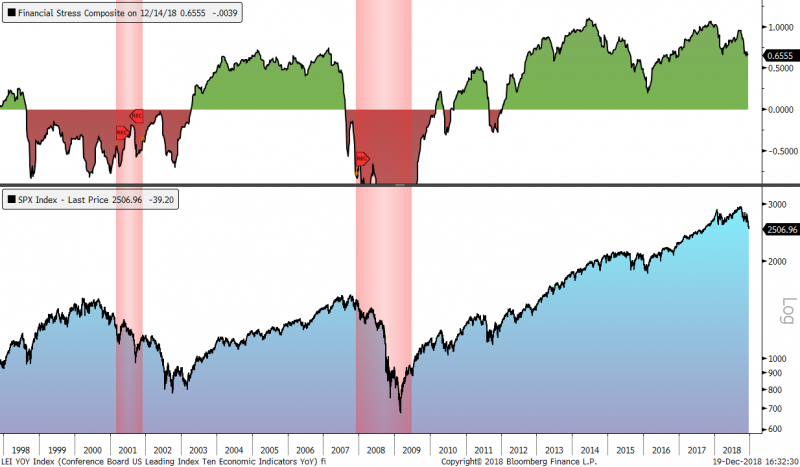
Conference Board US Leading Economic Index and Financial Sense LEI’s- Though they are weakening they remain in positive territory and well above recessionary levels.

Together I believe these indicators paint the picture of a slowdown – not a bear market or recession. Earings and GDP estimates were too high in 2018. The broad correction in stocks is bringing growth back into alignment.
Current Outlook- I think the Fed will back down a little more concerning rate hikes in Q1 of next year. The stock market should find support around the time oil bottoms – then rally together.
Typically the final push into a bull market top is accompanied by running commodity prices. Commodities (precious metals and oil) usually top a few months after the stock market…not before. Consequently, I think the next bottom in oil could become the launchpad for a 300%+ rally. I don’t foresee the general stock market topping out until mid/late 2020. Of course, for any of this to happen, we first need a bottom in stocks and oil.
-Gold- The 30-day cycle supports a turning point between December 27th – 31st. I assumed it would time another bottom – If not, then it could mark an inverted cycle peak. What happens next likely depends on the stock market and how investors perceive the government shut down. I’ll use a daily close below $1255 to confirm a top.

-US DOLLAR- The dollar is all over the place and difficult to gauge. It looks like prices are searching for a cycle low. Progressive closes above the 10-day EMA will organize a bottom.

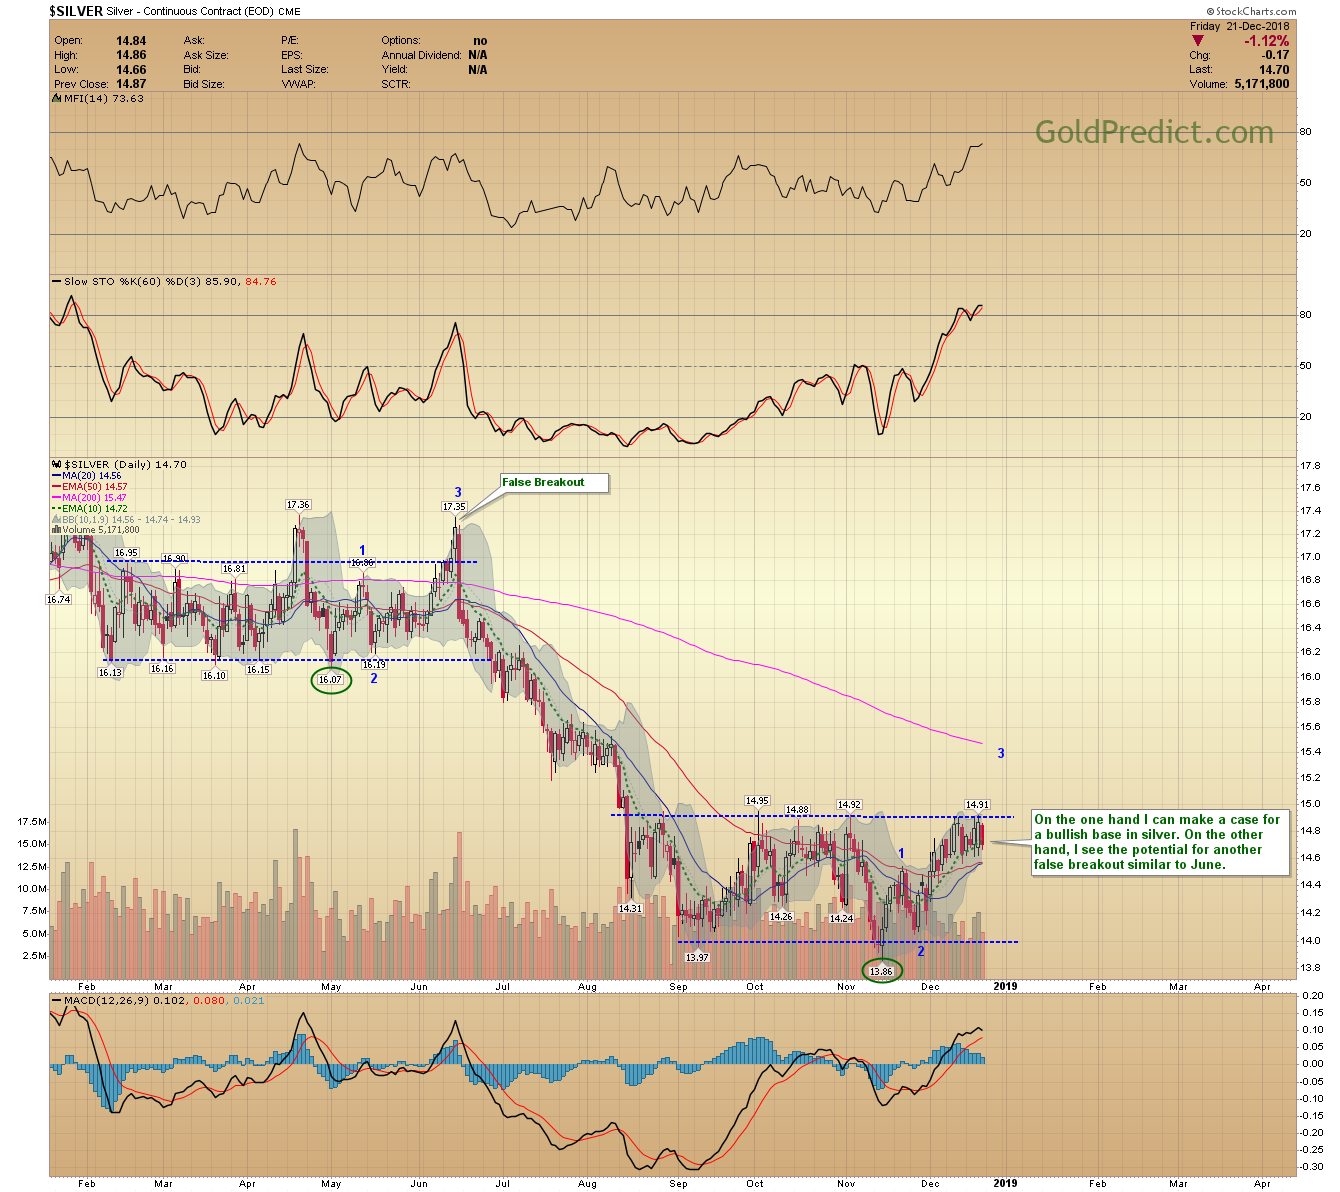
-SILVER- On the one hand I can make a case for a bullish base in silver. On the other hand, I see the potential for another false breakout similar to June.
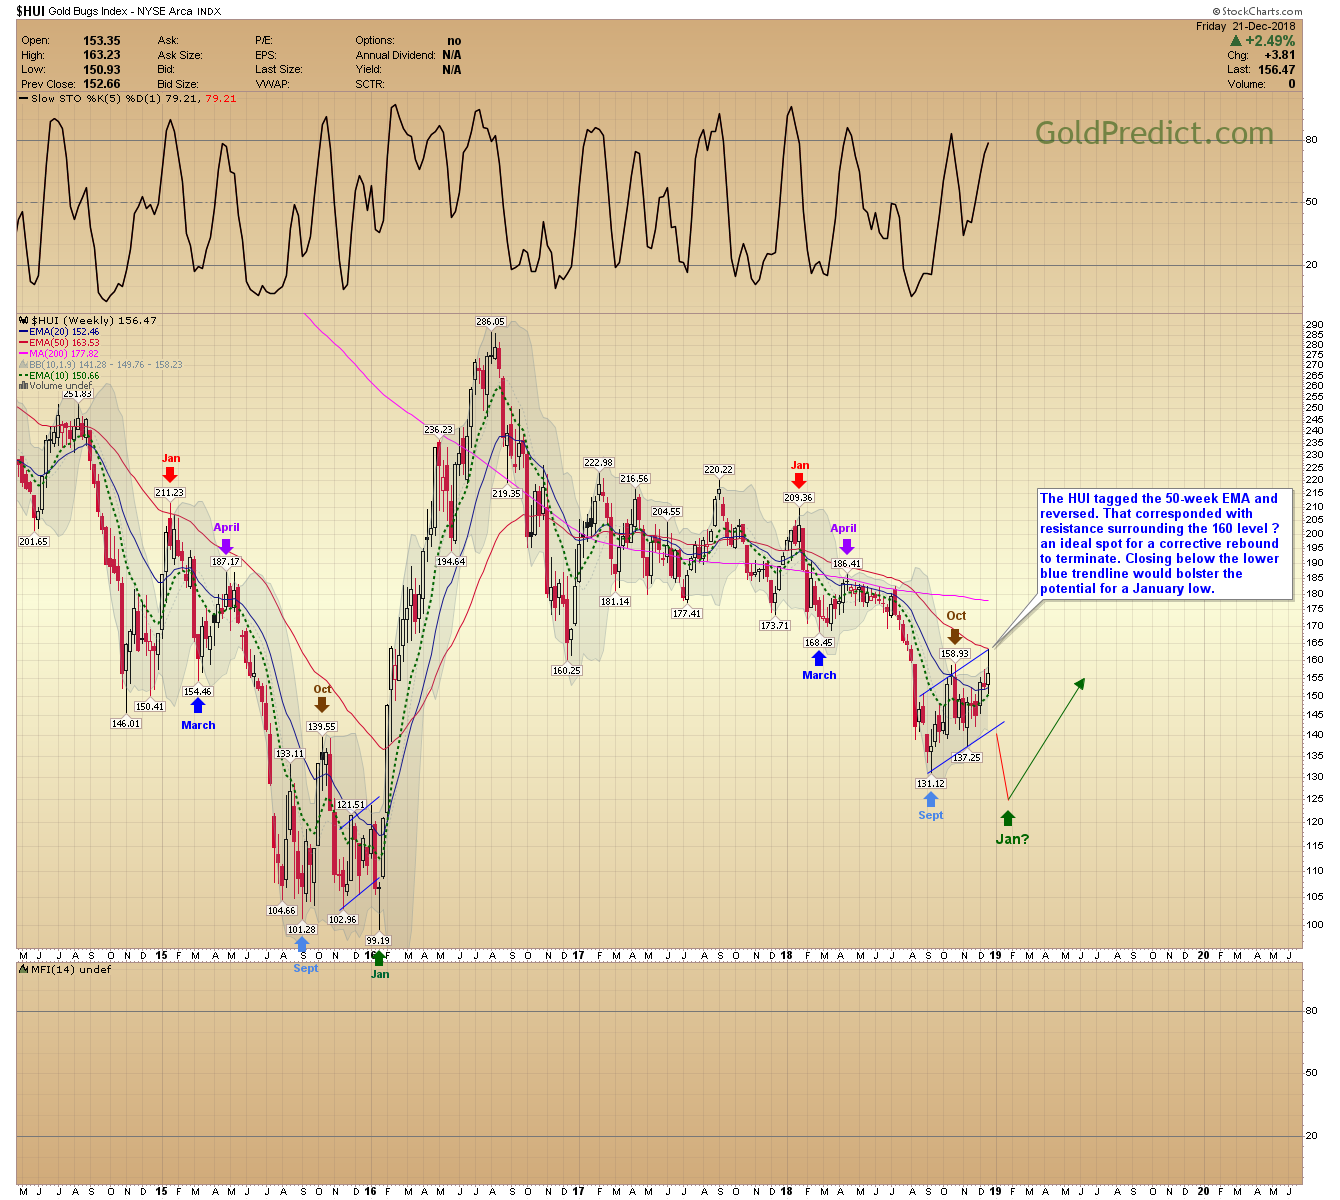
-HUI WEEKLY- The HUI tagged the 50-week EMA and reversed. That corresponded with resistance surrounding the 160 level — an ideal spot for a corrective rebound to terminate. Closing below the lower blue trendline would bolster the potential for a January low.
-GDX- The battle over the 200-day continues. As I said Thursday – I can’t recall miners successfully reversing a massive bearish candle, like Wednesday. Though the odds favor a top, we shouldn’t ignore the bullish connotations if GDX were to close above $21.36 successfully.

-GDXJ- Juniors fell Friday but bounced as they approached the 10-day EMA. I see the potential for an ABC flat correction peaking Wednesday. However, I can’t rule out a double bottom formation if juniors close progressively above Wednesday’s $30.14 high. To support a campaign to the buy zone, prices need to close below the Fed-day $27.89 low.

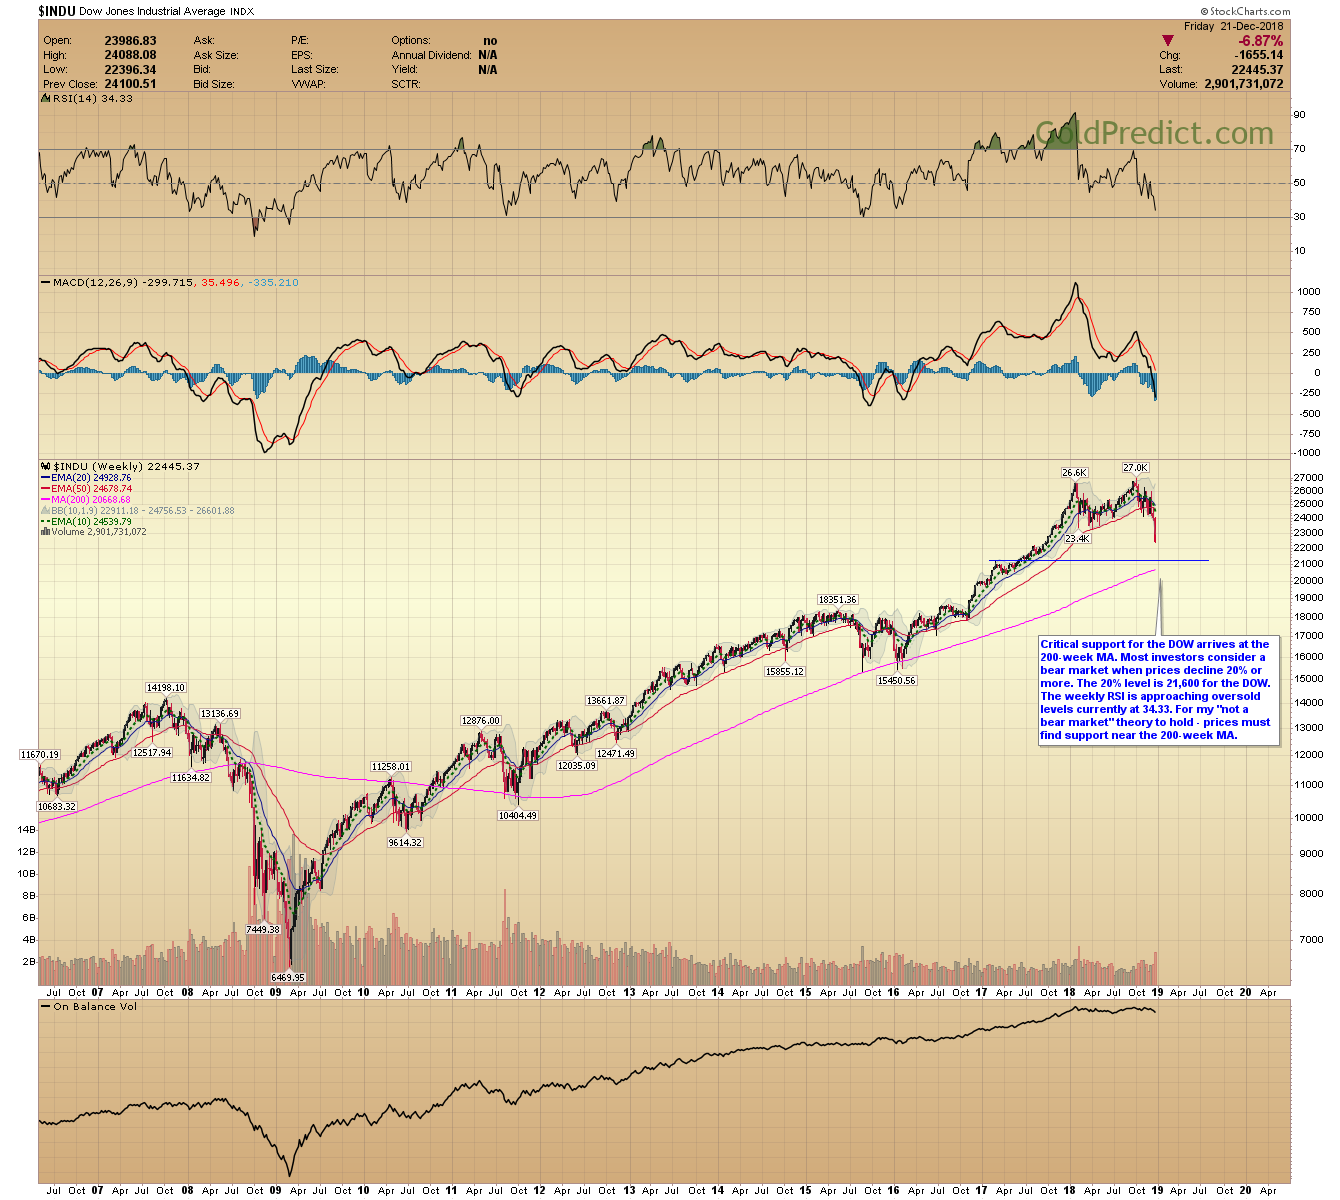
-DOW WEEKLY- Critical support for the DOW arrives at the 200-week MA. Most investors consider a bear market when prices decline 20% or more. The 20% level is 21,600 for the DOW. The weekly RSI is approaching oversold levels currently at 34.33. For my “not a bear market” theory to hold – prices must find support near the 200-week MA.
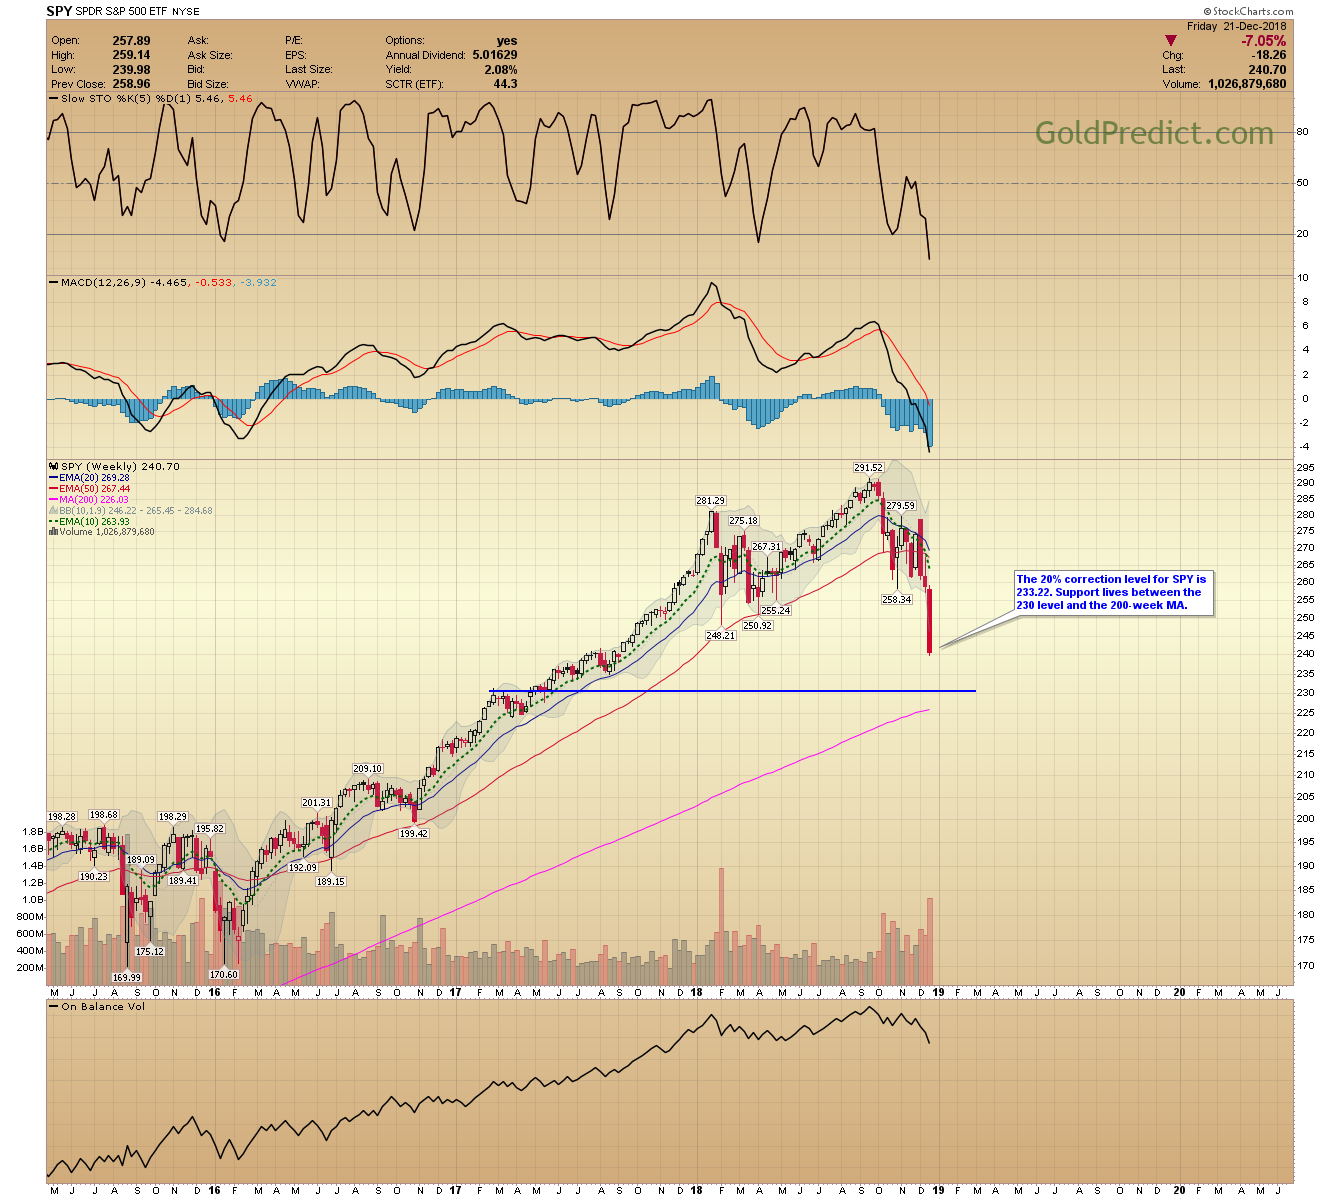
-SPY WEEKLY- The 20% correction level for SPY is 233.22. Support lives between the 230 level and the 200-week MA.
-CRB WEEKLY- The CRB is approaching the head and shoulder target box. Commodities should be reaching their 3-year low.

-WTIC MONTHLY- If I’m reading the stock market and commodities correctly oil should bottom just below the lower Bollinger band in Q1 2019. From there, we could see a multi-month surge into 2020/2021. The last three 8/9 bottoms generated 340% rallies.

US markets close at 1:00 PM on Monday, December 24th. No trading and no Tuesday report on December 25th.
Thanks and Happy Holidays!