
The trade war between the U.S. and China escalated Friday when China announced new tariffs on $75 billion of U.S. goods. Trump retaliated and ordered U.S. companies to find an “alternative” to operating in China.
Later, President Trump announced he would raise tariffs on $250-billion of Chinese imports from 25% to 30% starting October 1, 2019. Additionally, planned tariffs on another $300-billion of Chinese goods will increase to 15% from the proposed 10% declared in August.
The escalating trade war sent stocks sharply lower. Gold surged to finish the week at $1537.60. Some of the news (tweets) came after the market closed. Friday’s trends are likely to carry over into next week.
Gold is testing long-term resistance between $1525 – $1550. After spiking to $1546, prices consolidated maintaining support and the 10-day EMA – a top was not confirmed. Gold is now positioned to break above $1550 early next week.
What happens from here? In Friday’s gold update I discussed the potential for a terminal spike above $1546 that attracts eager investors sitting on the sidelines. If this scenario plays out, we could see an emotional surge next week that reverses by Thursday or Friday. I’ll monitor this possibility and update throughout the week.
Looking back at the 2002 breakout in gold, I found some interesting correlations that may apply to our current situation. The charts and patterns are very similar (see below).
THE 2002 BREAKOUT: After building a multi-year base prices broke out above $330 in 2002 and confirmed a new bull market. The initial rally surged and temporarily spiked above the bear market inflection point ($380) before entering a multi-week correction.

THE 2019 BREAKOUT: Similar to 1996 through 2003, we have a multi-year base followed by a bull market breakout. The initial surge is underway and approaching the 2013 bear market inflection point ($1550). We could see a quick spike above $1550 before prices finally correct. Gold would have to rise above $1625 to support a runaway move to $1700+ fueled by the U.S./China trade war.

Gold has rallied nearly $300 since May. The technicals are overbought, and a correction is warranted. The commercials increased their short position to near-record levels at -336,250 contracts. At some point, prices will correct, it’s just a matter of when.
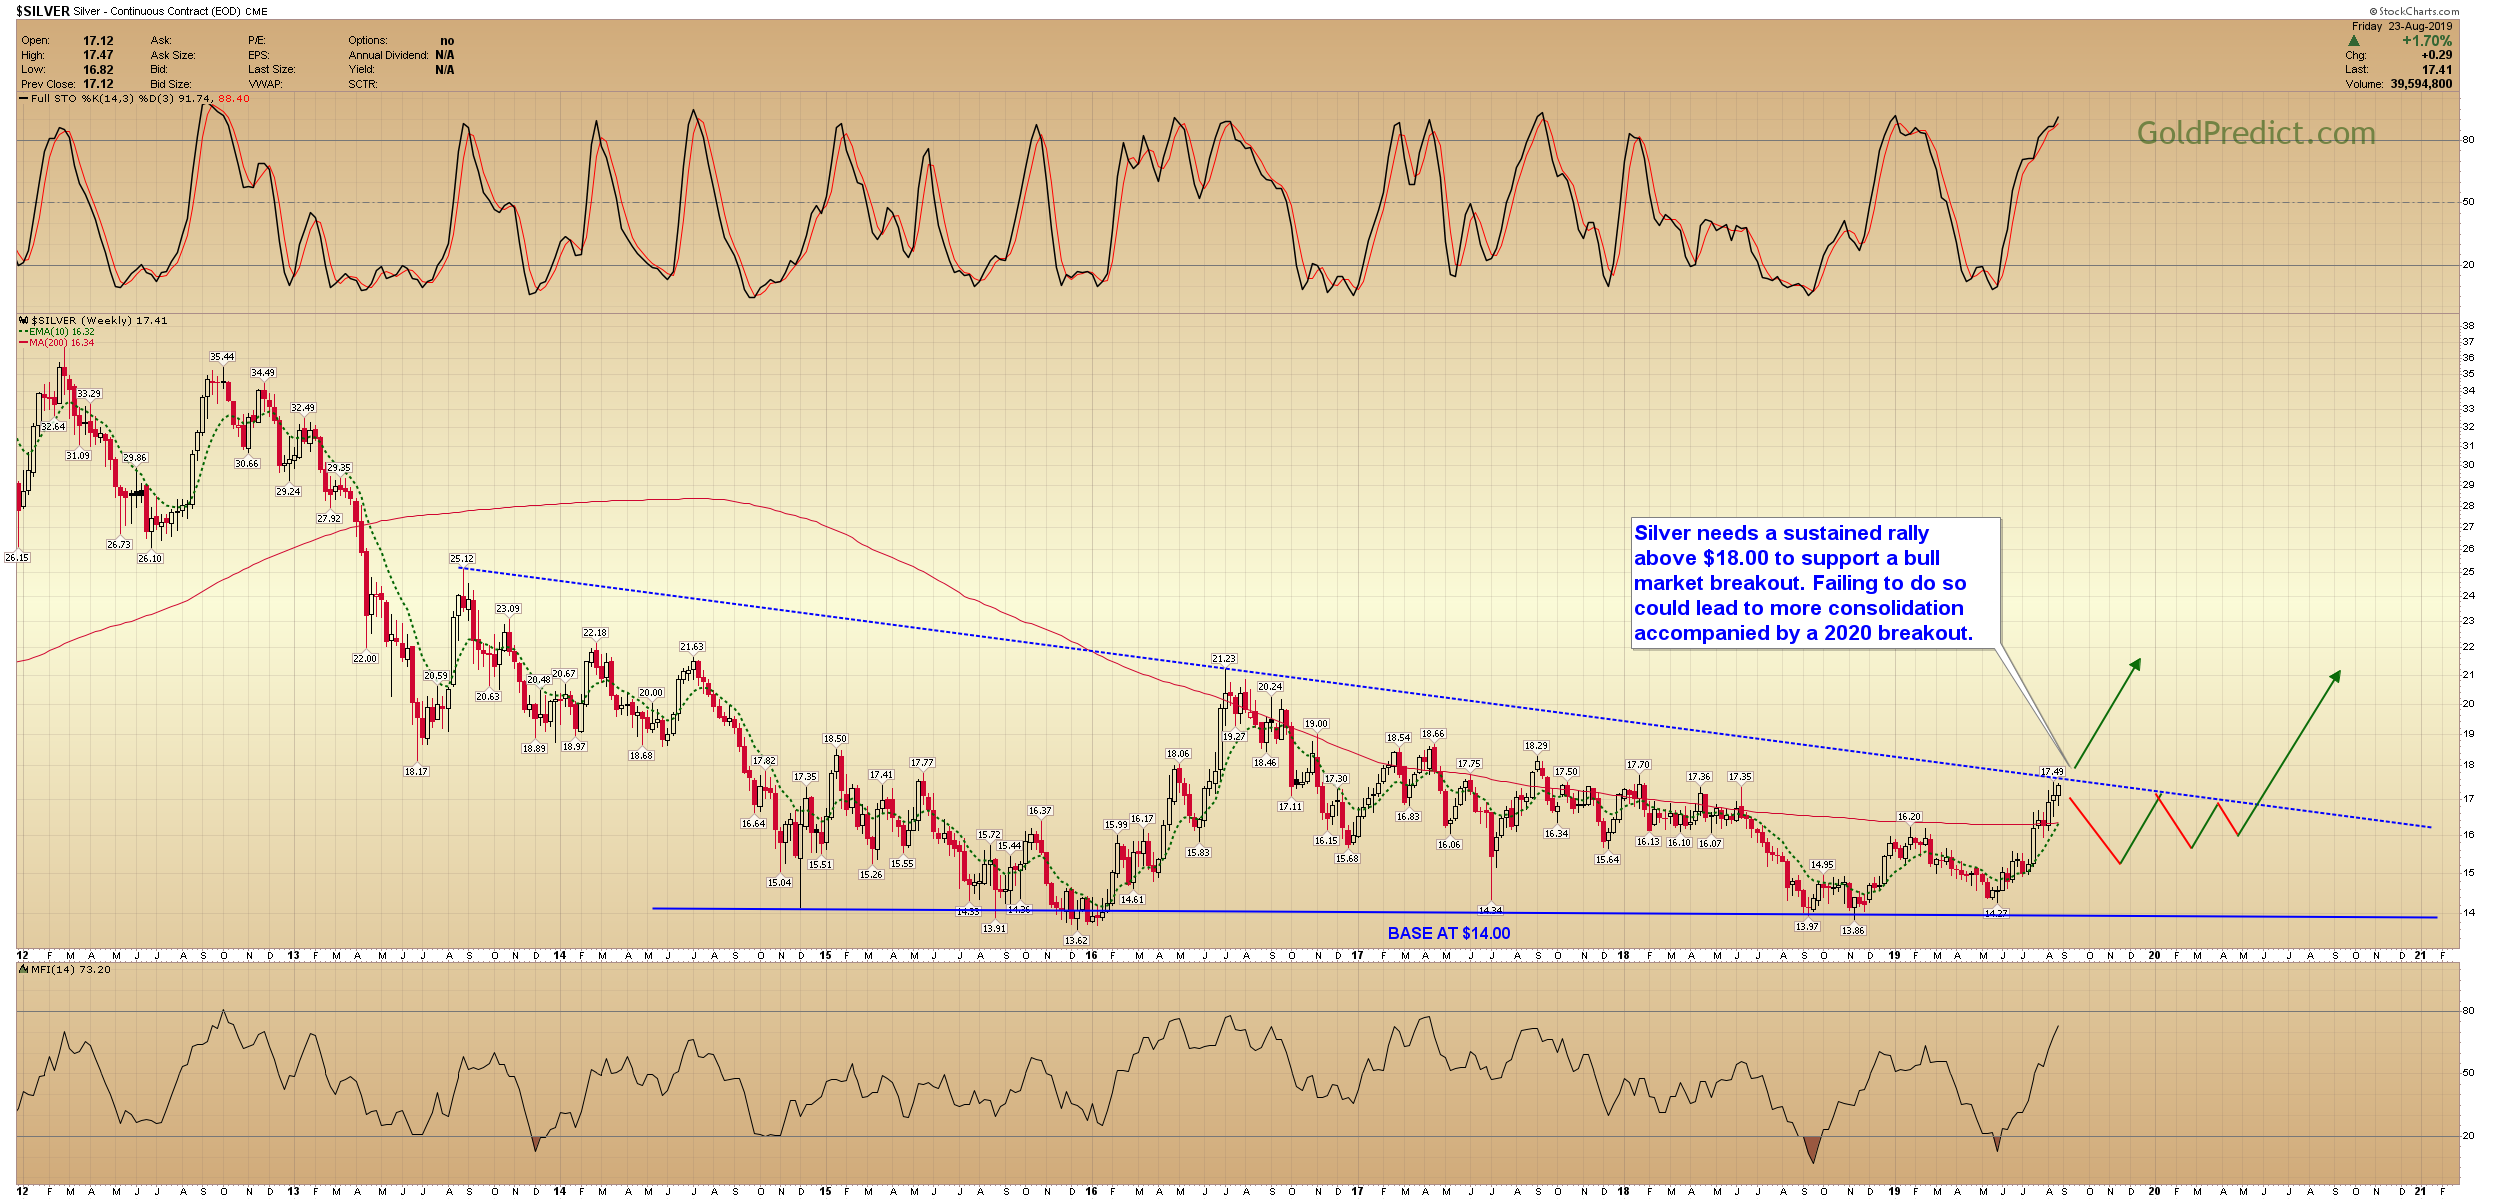
-SILVER WEEKLY- Silver needs a sustained rally above $18.00 to support a bull market breakout. Failing to do so could lead to more consolidation accompanied by a 2020 breakout.
-PLATINUM WEEKLY- Prices are building a long-term base near $800. A breakout above the descending trendline would support an initial run to $1300+. I’m very bullish on platinum and silver long-term.

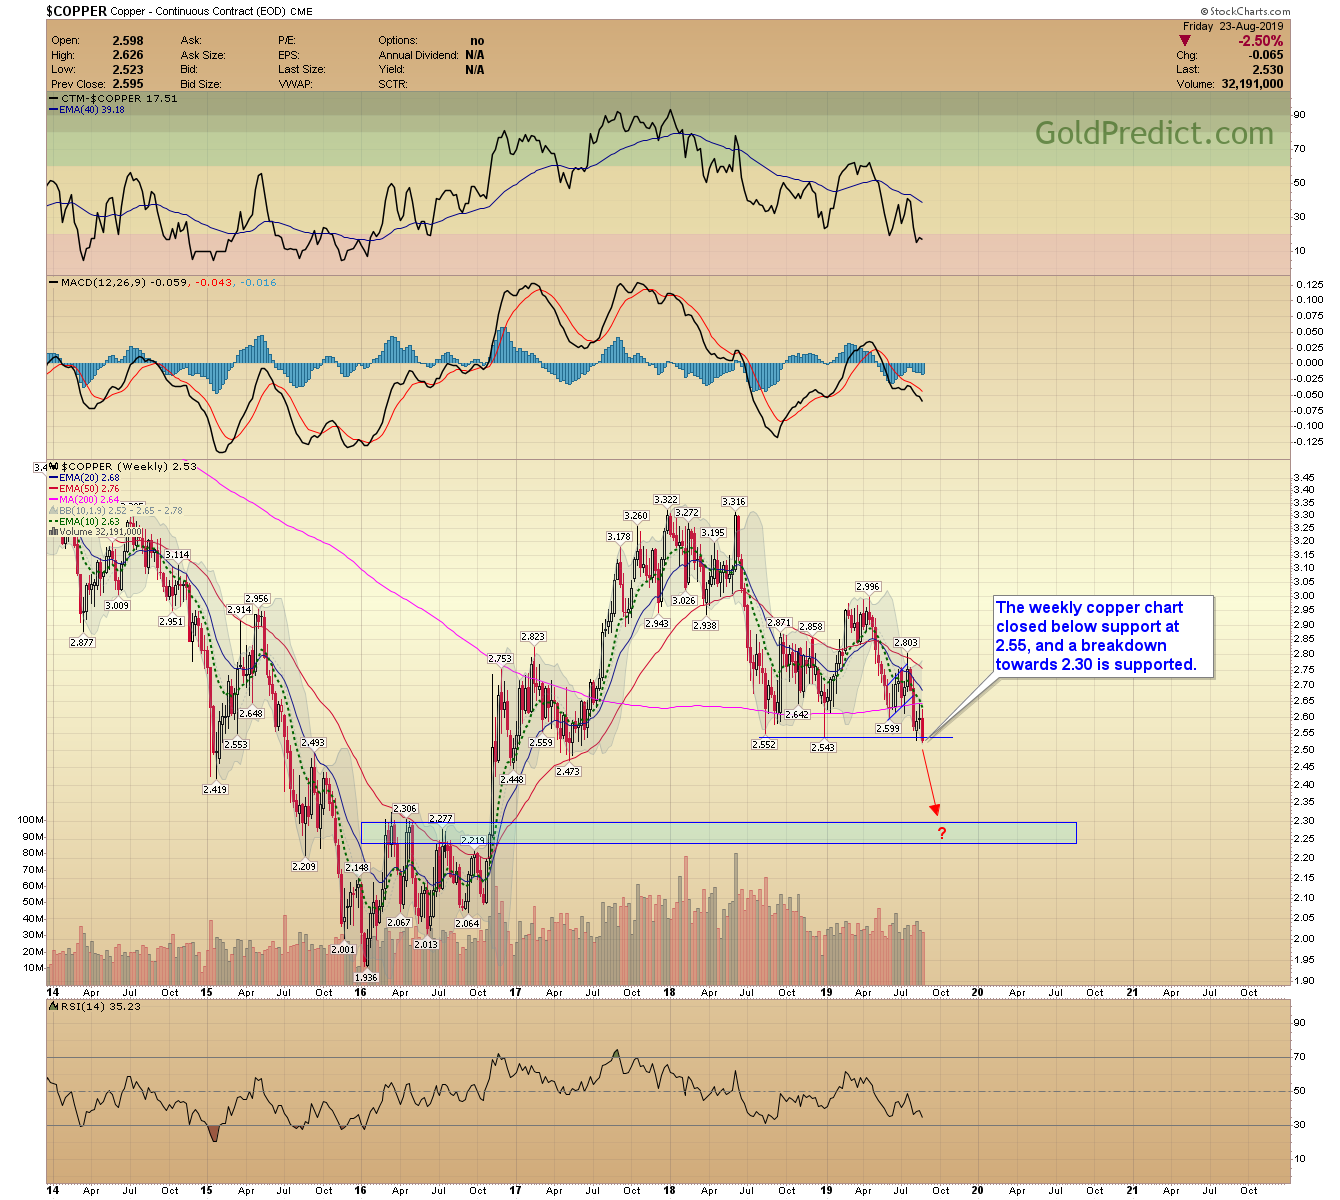
-COPPER WEEKLY- The weekly copper chart closed below support at 2.55, and a breakdown towards 2.30 is supported.
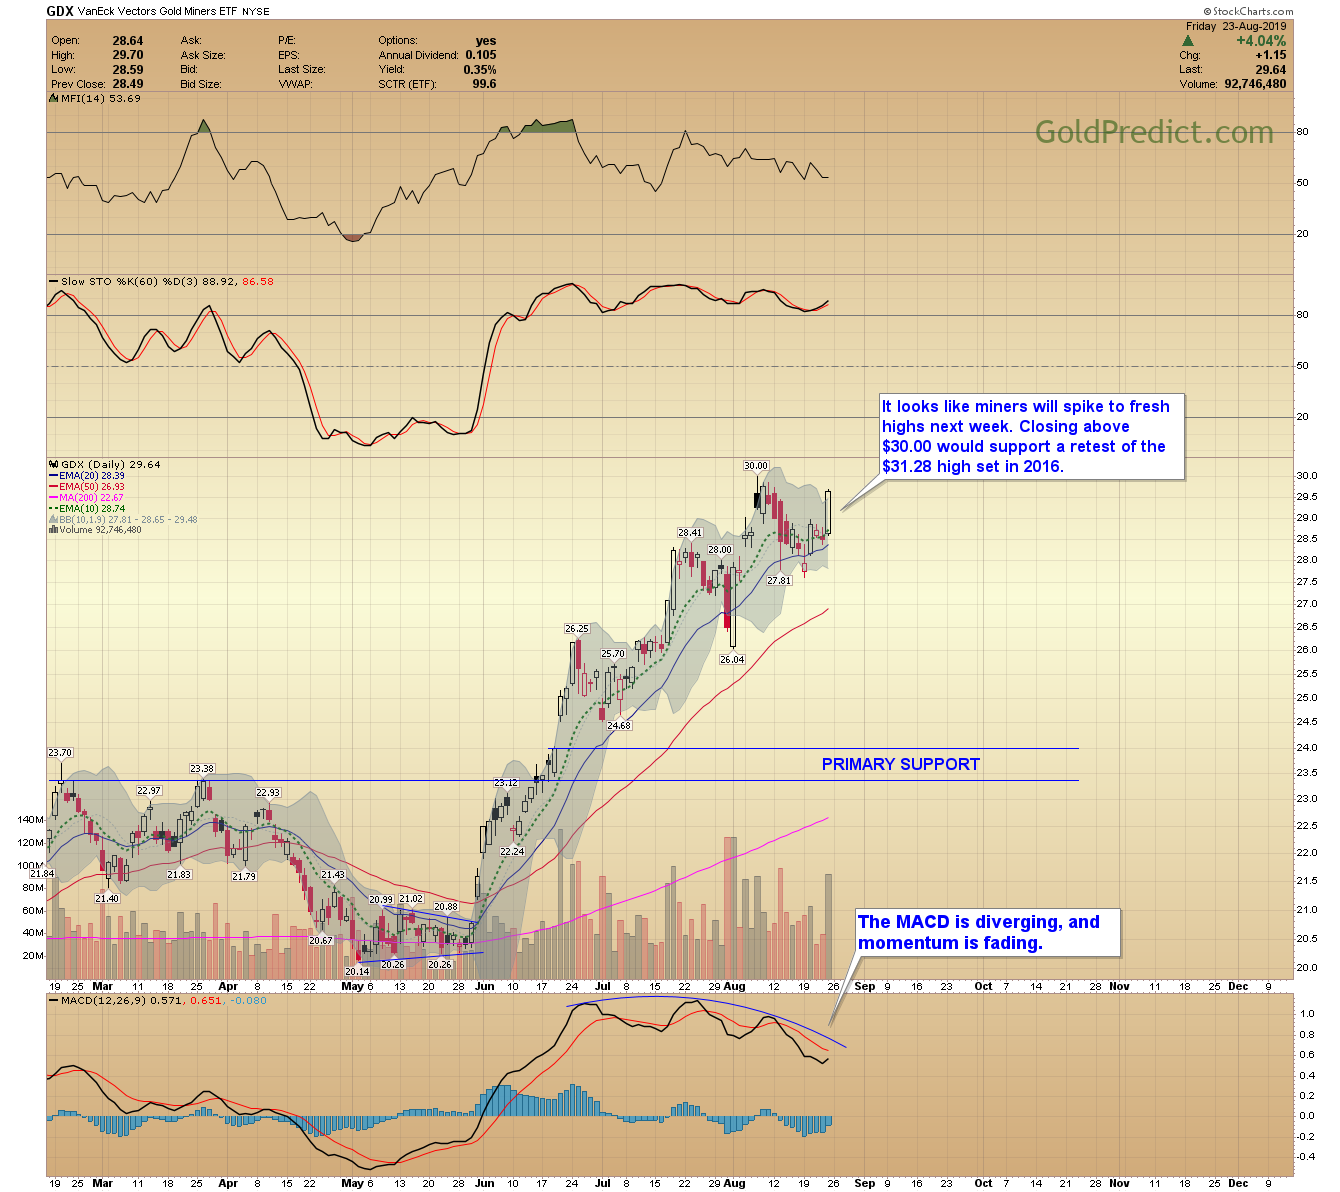
-GDX- It looks like miners will spike to fresh highs next week. Closing above $30.00 would support a retest of the $31.28 high set in 2016.
-GDXJ- Juniors are setting up to test and perhaps break the $43.10 high set earlier in August.

-SPY- Downside follow-through early next week could trigger a test of support just below the 200-day MA. Prices would have to collapse below 270 to recommend a more ominous breakdown.

-WTIC- Oil remains weak, and there’s no evidence of a bullish trend reversal. Prices could slip back and test support near $50.00.

In summary, gold is in a new bull market, and prices are testing significant resistance near $1550. The commercial traders (smart money) have near-record shorts…a bearish warning. We may get a terminal spike above $1550, followed by a sudden reversal – expect increased volatility. Gold would have to surge above $1625 to recommend a runaway move.
Have a pleasant weekend.