
Gold futures are trying to hold support near $1500 ahead of next weeks Fed announcement. Our intermediate forecast supports a pullback into October/November. A backtest of the $1380 breakout area could become one of the last great buying opportunities.
Sometimes one chart can some up years of commentary. For an eagles-eye view, I prefer the monthly chart. It minimizes daily/weekly fluctuations and paints a clear picture. The monthly chart of gold is screaming – BREAKOUT!
MONTHLY GOLD CHART: Take a good look at the chart below. Notice the rounded bottom that preceded the 10-year bull market that began in 2001. The same pattern is unfolding now. Gold recently broke out of the rounded bottom on record volume. If we get a repeat of the 2002/2003 pattern, a backtest of the $1380 breakout area may become the last great buying opportunity.

Longer-term, we expect gold to complete the larger 10-year pattern and breakout to new all-time highs in 2021 or 2022.
As prices correct, precious metal investors should assemble a list of their favorite gold and silver stocks. I still like the potential head and shoulder bottom setting up in Coeur Mining (CDE) described in my article A Top Becoming Likely.
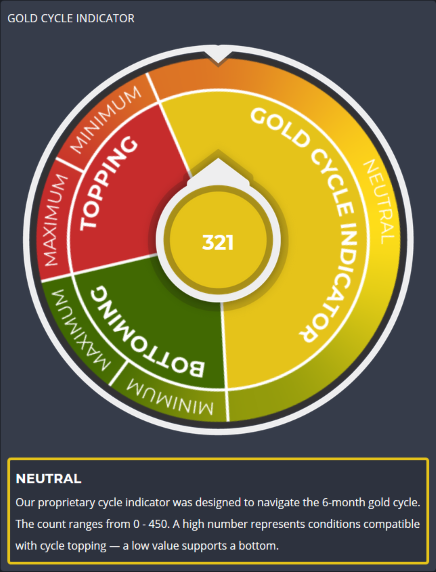
Our proprietary cycle indicator remains in neutral territory after peaking in August. I won’t expect an intermediate low until it slips below 100 (currently 321).
Have a safe and pleasant weekend!