
On Friday, the Trump administration announced a partial trade deal with China. I think this was the news event we need to trigger the next phase of the decline in metals and miners.
The correction process into a 6-month low is usually involved — more times than not, its an exercise in patience. Typically you can divide the cycle correction into four stages. I think the current trend is about to enter stage three. Below is a brief description of each.
- Stage 1 (The Cycle Top): Gold has rallied at this point for several weeks; bullish sentiment is high. However, a more in-depth look reveals weakening underlying momentum portrayed by negative divergences in the MACD and RSI. Eventually, prices peak, and we mark the cycle high.
- Stage 2 (The Topping Process): The uptrend is showing signs of weakness, but it’s unclear if prices topped. Sentiment remains firmly bullish with most traders still positioning for new highs – many overleveraged. However, the market is running out of buyers – rallies decay and prices fail to maintain new highs.
- Stage 3 (A Top Acknowledged): After a couple of failed rallies, bullish sentiment begins to wane. The bears, once timid, start to grow in confidence. It’s at this point we can see a sharp down day as overleveraged traders acknowledge a trend reversal (sometimes all at once) and race to the exits. The bulls stop looking for new highs and begin looking lower.
- Stage 4 (The 6-Month Low): Prices have declined long enough and deep enough to drive sentiment from bullish back to bearish. Everyone that was expecting new highs at the top is now calling for new lows – some are even shorting the market. Our Gold Cycle Indicator is below 100 and in bottoming territory. Ideally, we’ve seen at least a 50% reduction in commercial net-shorts from the peak.
**I think we will enter stage three once metals and miners break their October 1st lows.
COT UPDATE: Commercials added 7,254 short contracts last week for a new net-short position of -310,492. It could take several weeks to unwind those positions to a reasonable level (ideally below 170k).
-GOLD WEEKLY- The weekly chart finally closed below the 10-day EMA confirming an intermediate top. With our cycle indicator at 237 and commercial shorts above 300K, it will likely take a few more weeks to reach a 6-month low. I think gold will at least test $1400 – $1420, and the potential for a backtest of the breakout line surrounding $1380 remains.

-GOLD DAILY- I’ve drawn a target area for the next 6-month low. Once the gold cycle indicator (GCI) drops below 100, I’ll begin looking for a bottom.

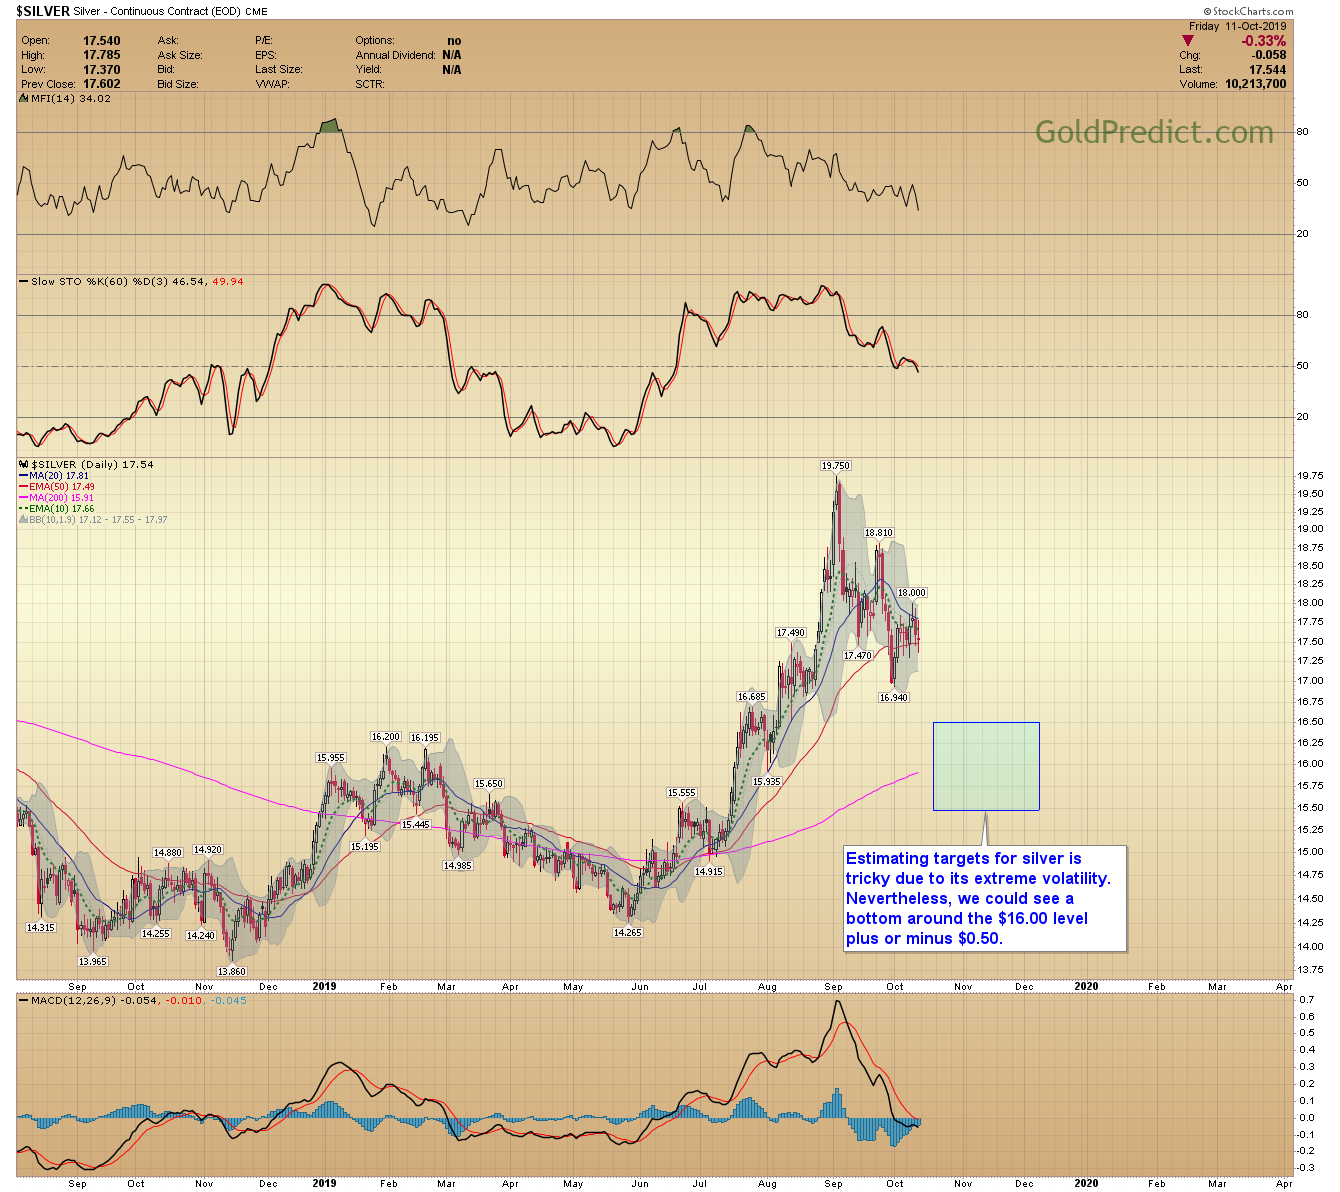
-SILVER DAILY- Estimating targets for silver is tricky due to its extreme volatility. Nevertheless, we could see a bottom around the $16.00 level plus or minus $0.50.
-PLATINUM- The platinum chart appears to be forming a small bear flag. A breakdown below $875 would support a decline to the highlighted target area. A retest of the trendline around $800 would provide an excellent low-risk entry.

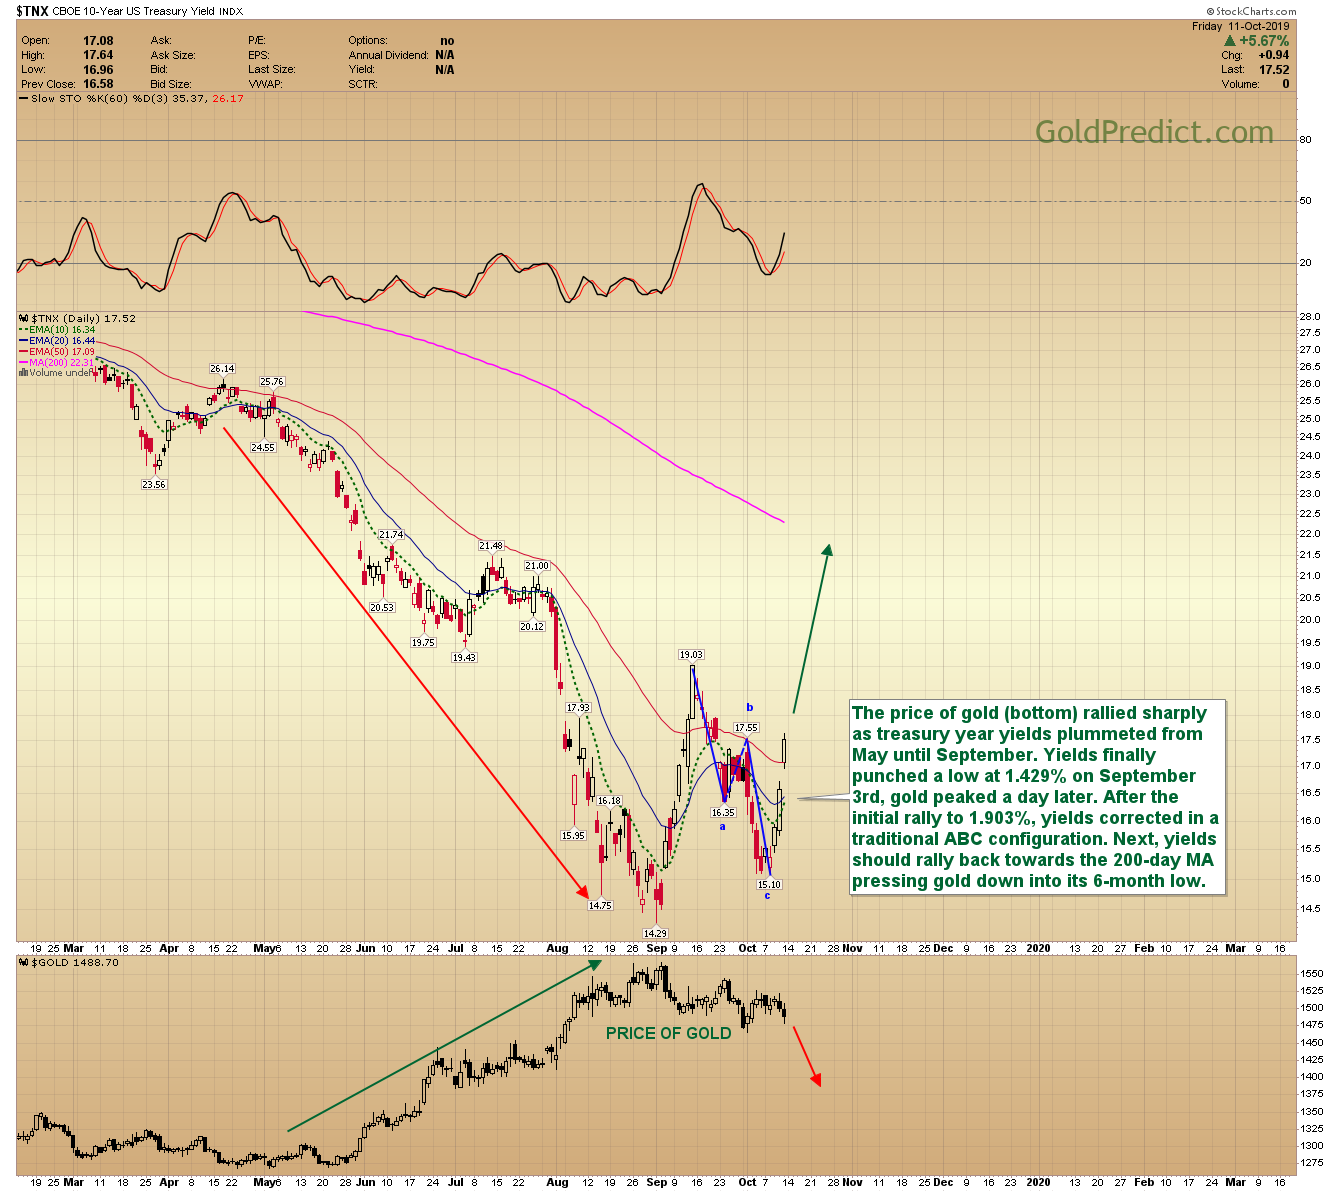
10-YEAR TREASURY YIELDS: The price of gold (bottom) rallied sharply as treasury year yields plummeted from May until September. Yields finally punched a low at 1.429% on September 3rd; gold peaked a day later. After the initial rally to 1.903%, yields corrected in a traditional ABC configuration. Next, yields should rally back towards the 200-day MA pressing gold down into its 6-month low.
-XAU CYCLE- It’s beginning to look like this cycle peaked on day six at 92.58. A breakdown below the 87.00 level would likely trigger a 3 to 5-day collapse to the gap area surrounding 79.00. From there, we could see consolidation and a final low in November or early December. Best guess anyway until we see how prices respond below 87.00. The next 42-46 day turning point is scheduled for late November or early December.

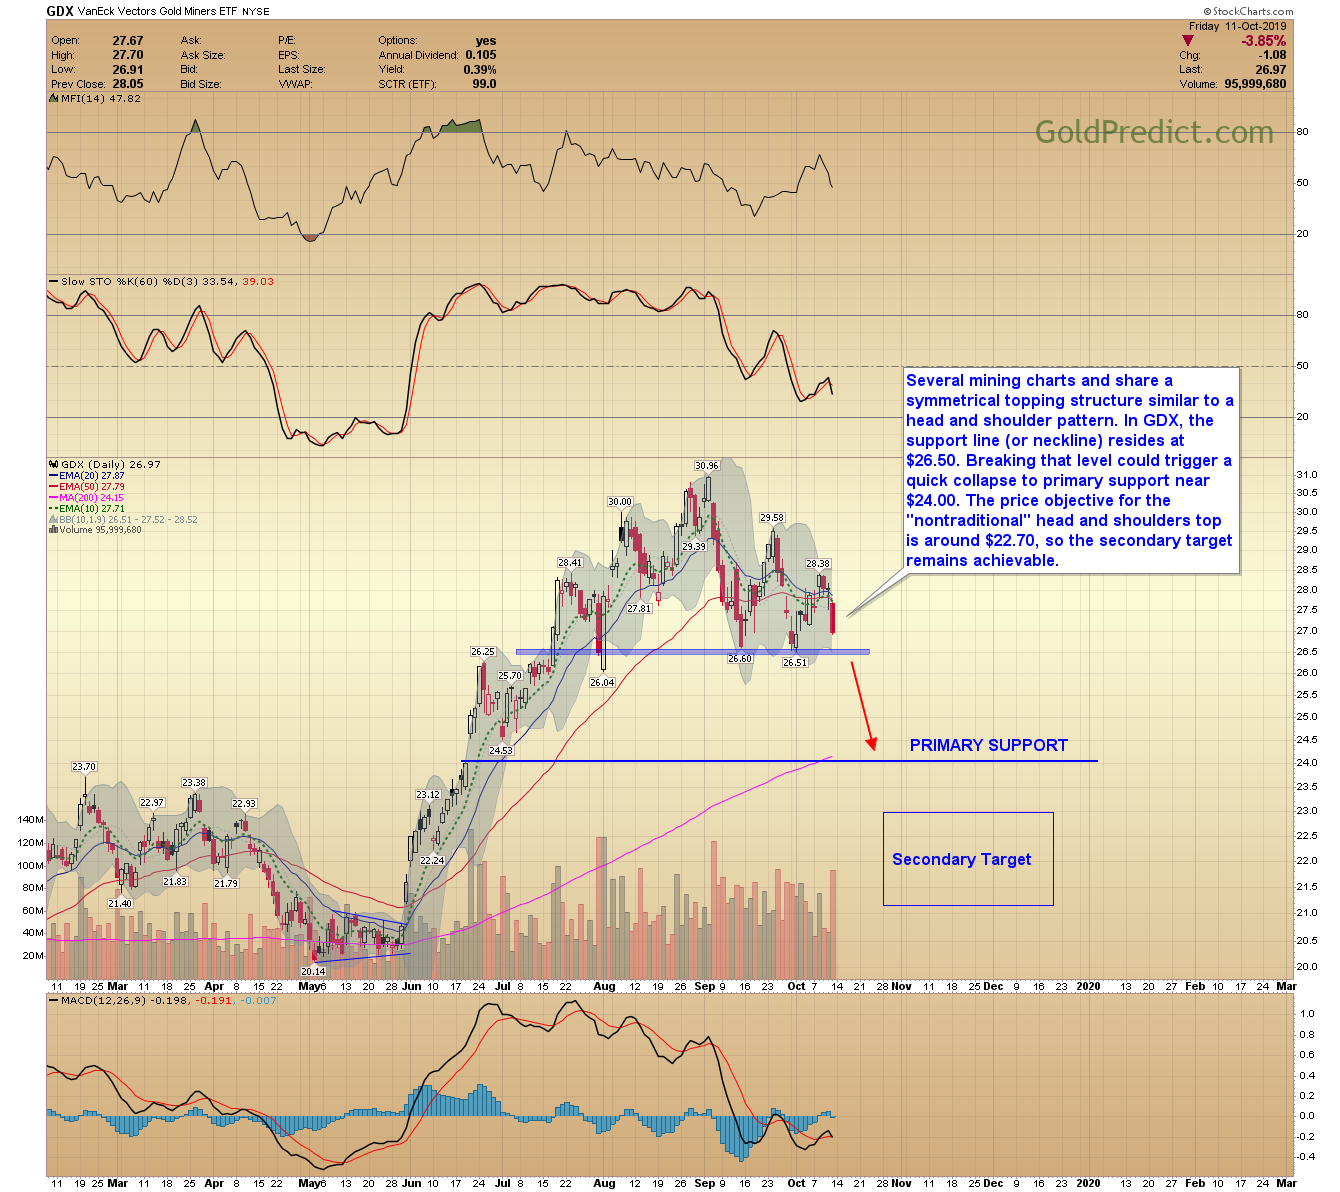
-GDX- Several mining charts and share a symmetrical topping structure similar to a head and shoulder pattern. In GDX, the support line (or neckline) resides at $26.50. Breaking that level could trigger a quick collapse to primary support near $24.00. The price objective for the “nontraditional” head and shoulders top is around $22.70, so the secondary target remains achievable.
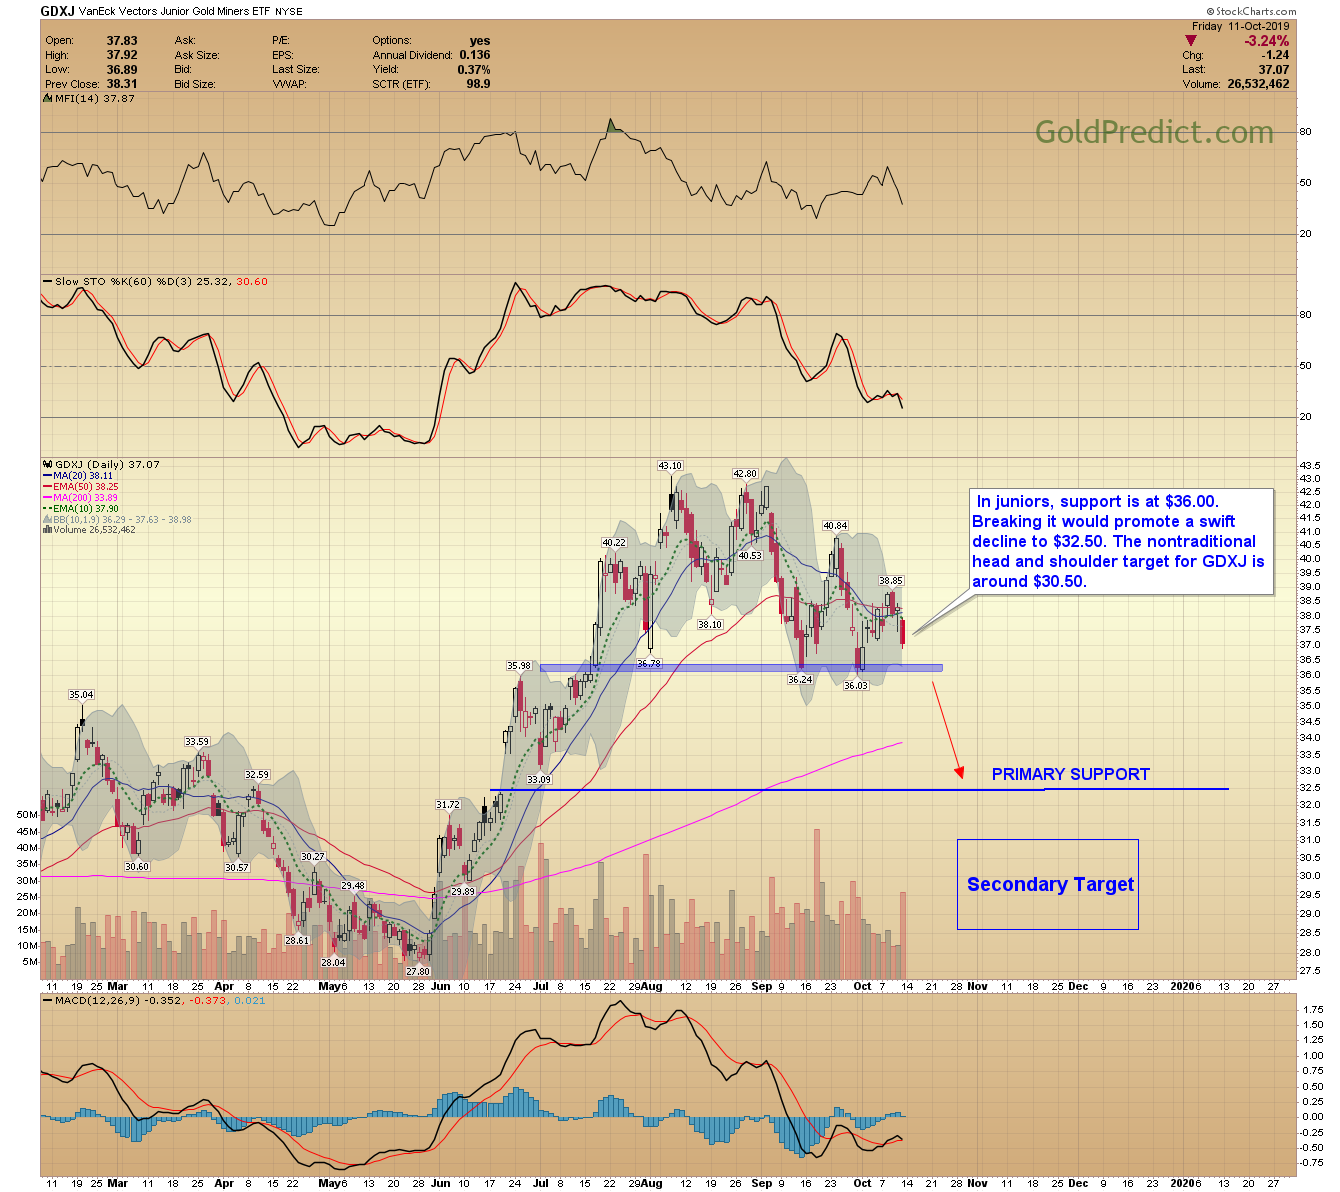
-GDXJ- In juniors, support is at $36.00. Breaking it would promote a swift decline to $32.50. The nontraditional head and shoulder target for GDXJ is around $30.50.
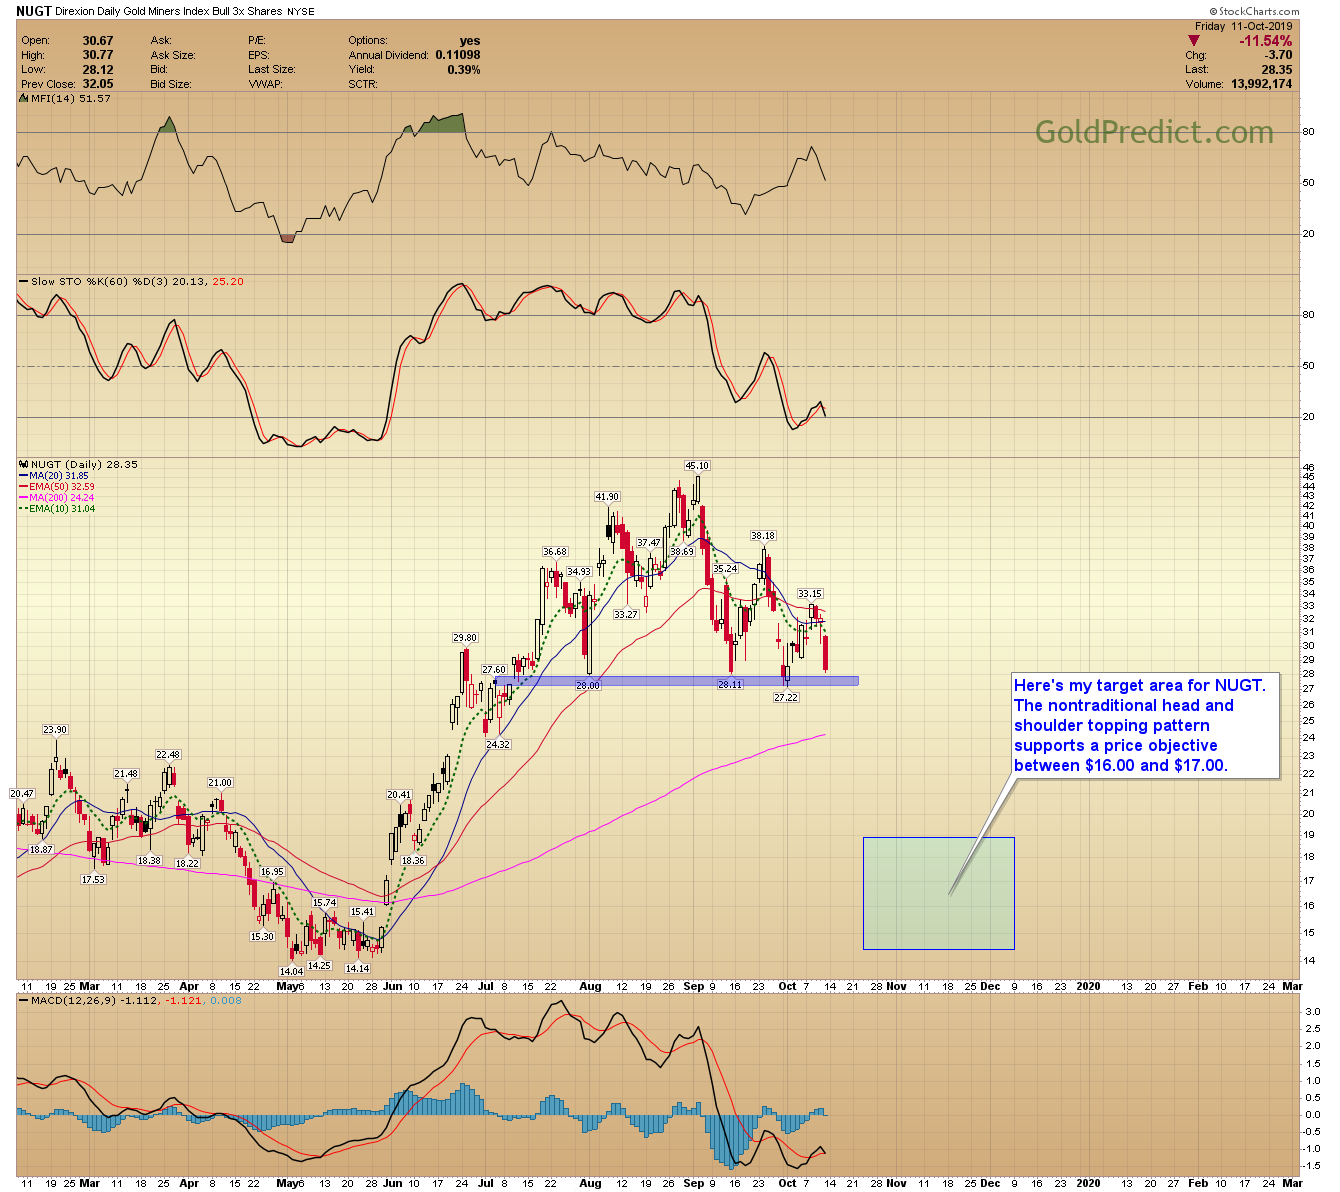
-NUGT- Here’s my target area for NUGT. The nontraditional head and shoulder topping pattern supports a price objective between $16.00 and $17.00.
-CDE- The head and shoulder bottom in CDE is still on track with an ideal target between $3.70 and $3.90.

-SPY- Stocks gapped higher Friday on news of successful trade negotiations. We will likely see a shift back to risk-on and new all-time highs.

Have a great weekend.
