
There is a significant uptick in coronavirus cases, and lockdowns are resuming.
The likelihood of a double-dip recession is increasing, and we could see another sharp selloff in stocks.
The 1980 pattern in the Dow is very similar to what’s transpiring now. If the stock market peaks next week like it did in 1980, we could have a playbook for the next few months.
THE NEXT WAVE OF COVID AND LOCKDOWNS
Coronavirus cases are on the rise, and I don’t see this trend slowing. The Midwest is being hit particularly hard. New daily cases reached 187,907 on Friday across the US – a surge of 80% in just two weeks.

https://www.worldometers.info/coronavirus/country/us/
Some argue that new cases are up because they’re doing more testing, and there’s nothing to worry about. I would tend to agree with them if hospitalization rates weren’t increasing. Those currently hospitalized with Covid has risen to 69,455 – well above the April and July peaks.
 https://covidtracking.com/data/charts/us-currently-hospitalized
The regional hospitalization map shows a spike in the Midwest (currently 24,263), more than double the May 6th peak of 11,483. There is usually a lag of about 2-weeks from when someone tests positive to when they are hospitalized – implying a spike continuing into late November. As hospital resources are overwhelmed, governments are likely to issue new stay-at-home orders.
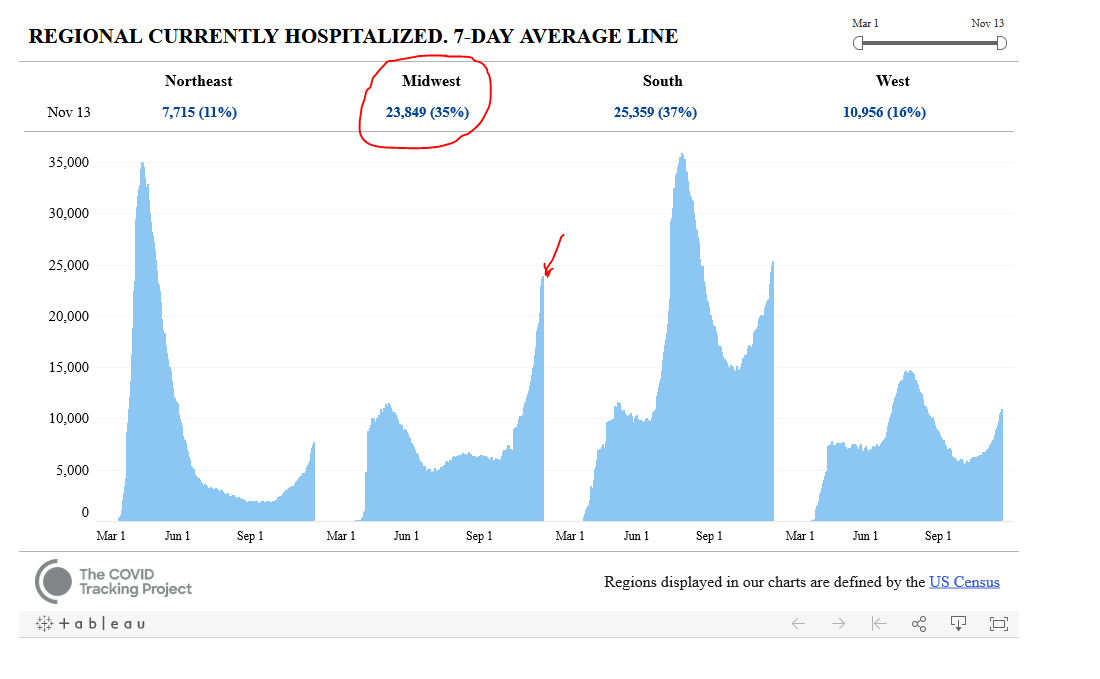 https://covidtracking.com/data/charts/regional-current-hospitalizations
Death rates in the Midwest are also reaching new highs. Considering the lag time (mentioned above), this trend is likely to continue over the next several weeks.
 https://covidtracking.com/data/charts/regional-deaths
1980 DOW CORRELATION
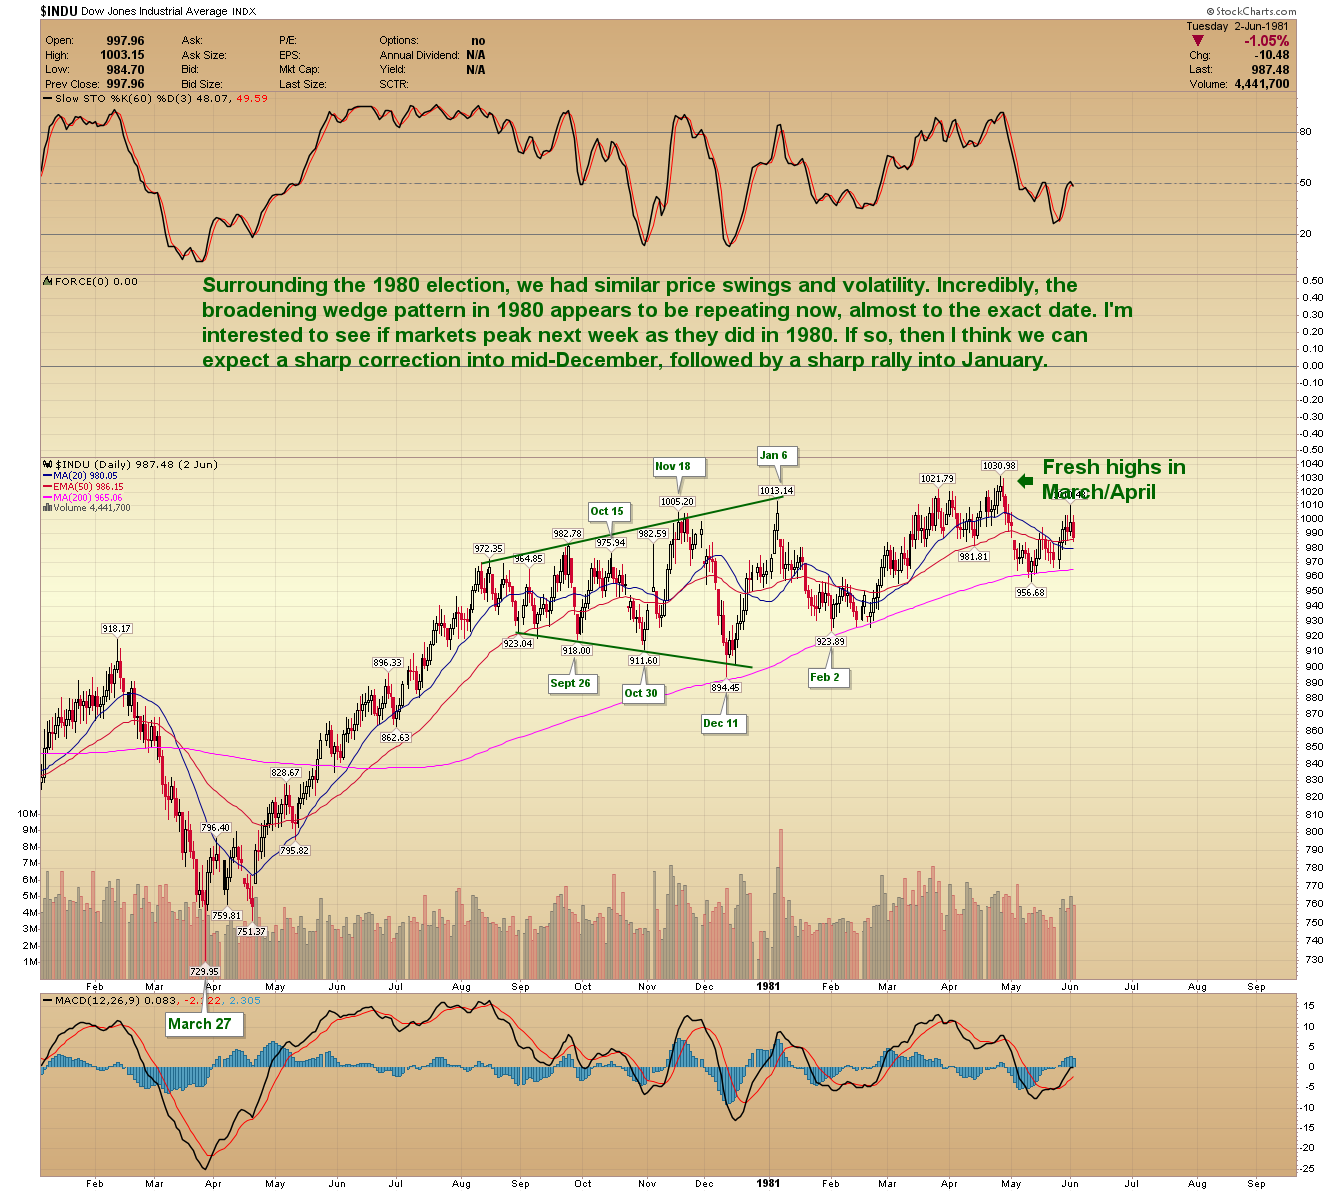
DOW 1980 PRICE ACTION: Surrounding the 1980 election, we had similar price swings and volatility. Incredibly, the broadening wedge pattern in 1980 appears to be repeating now, almost to the exact date. I’m interested to see if markets peak next week as they did in 1980. If so, then I think we can expect a sharp correction into mid-December, followed by a sharp rally into January.
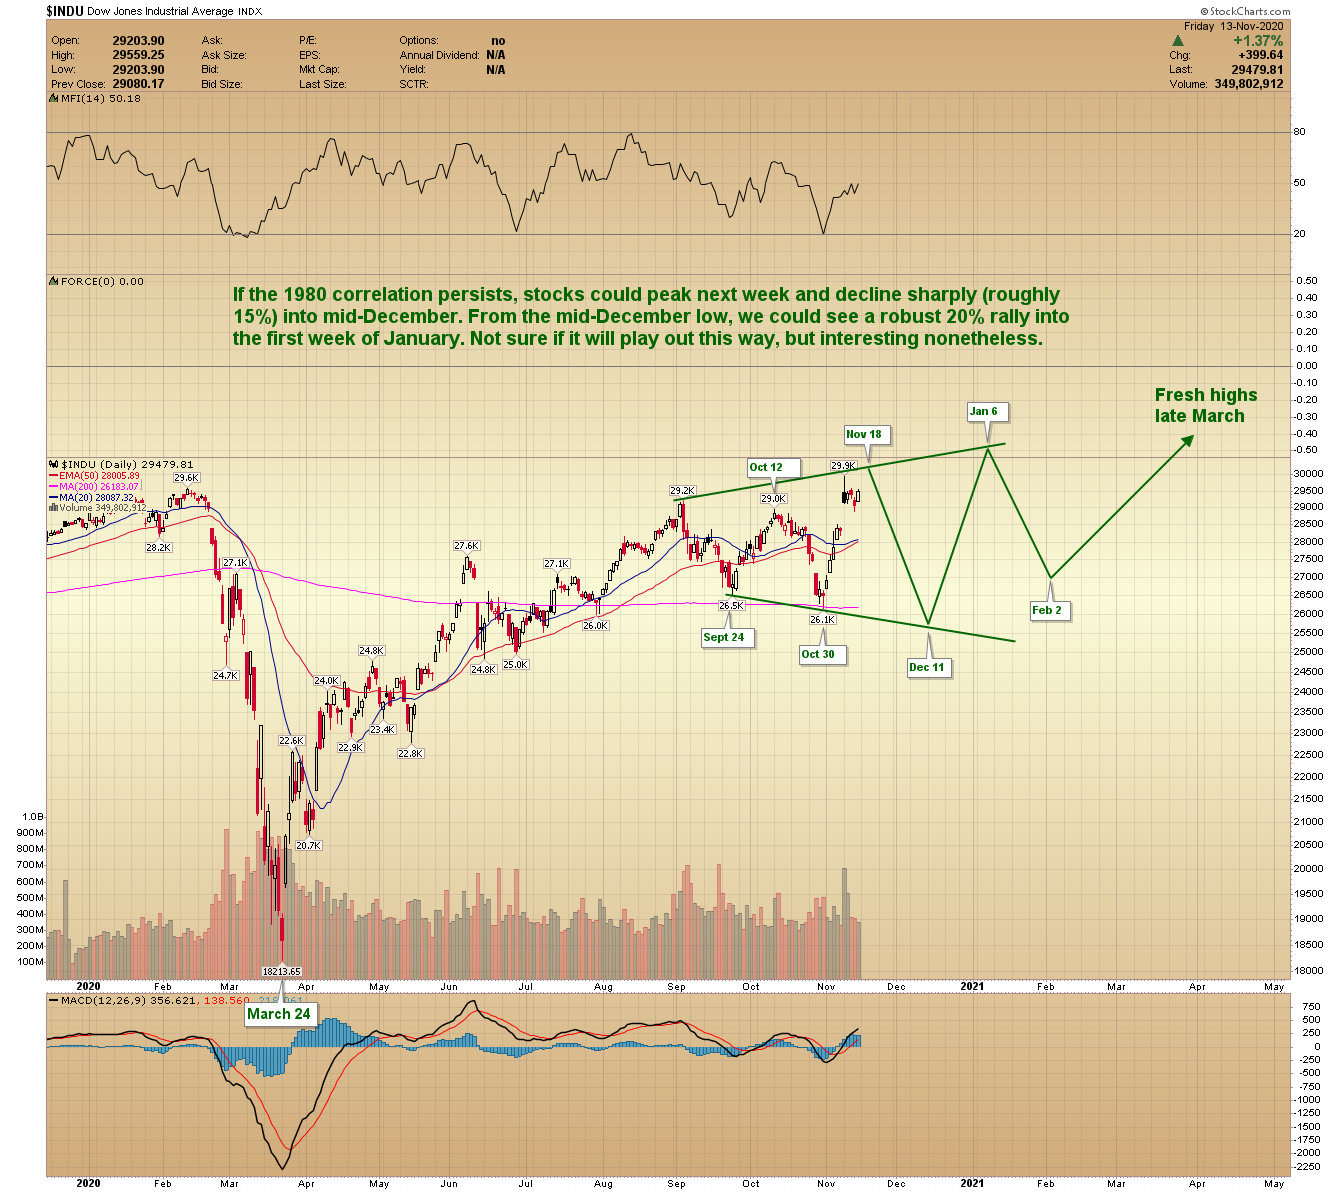
DOW 2020 PRICE ACTION: If the 1980 correlation persists, stocks could peak next week and decline sharply (roughly 15%) into mid-December. From the mid-December low, we could see a robust 20% rally into the first week of January. Not sure if it will play out this way, but interesting nonetheless.
Note- I find the above correlation very interesting. Let’s see what happens next week. Renewed lockdowns and spiking covid fears could trigger the sharp decline into mid-December.
PRECIOUS METALS
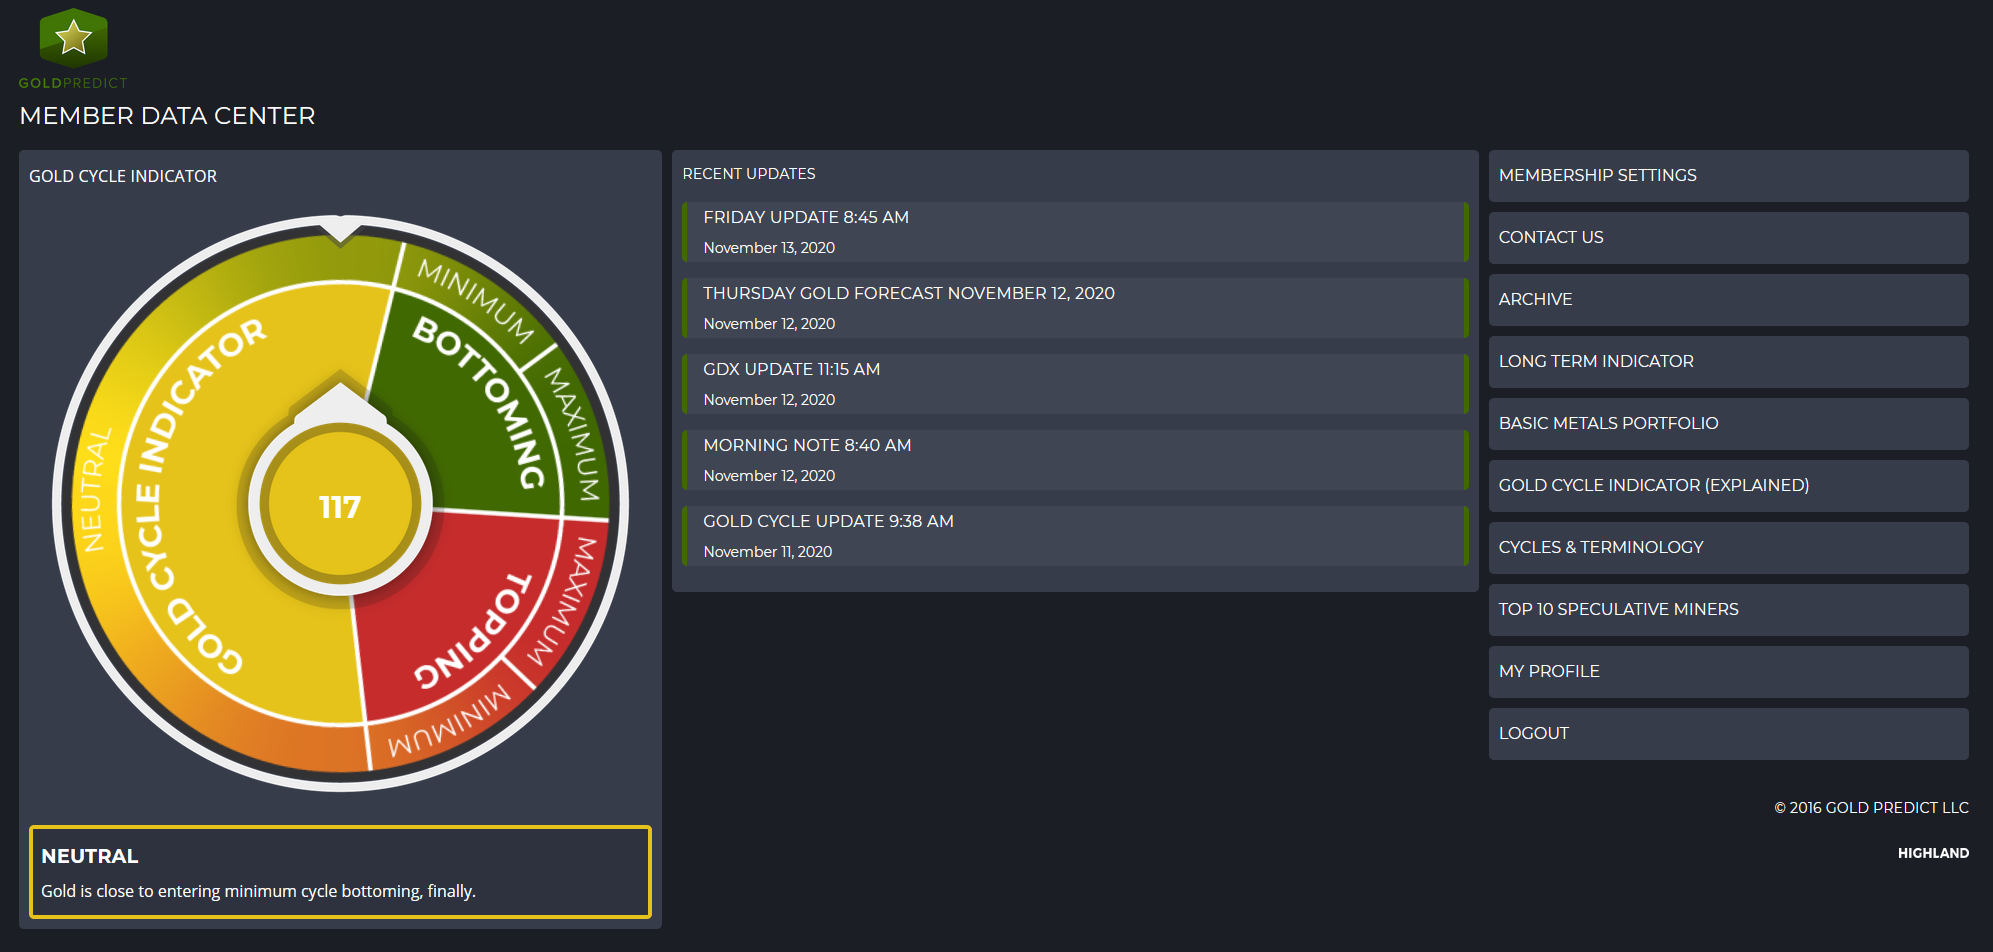
The gold cycle indicator finished the week at 117 – it came very close to dropping below 100 last week. If gold reaches our projected ABC target, it could fall to zero and reach maximum cycle bottoming.
-GOLD- Gold formed an inverted cycle peak in the November timing window, and prices should ultimately weaken into December. Depending on what happens with the stock market, I see the potential to decline to around $1750 by year-end.

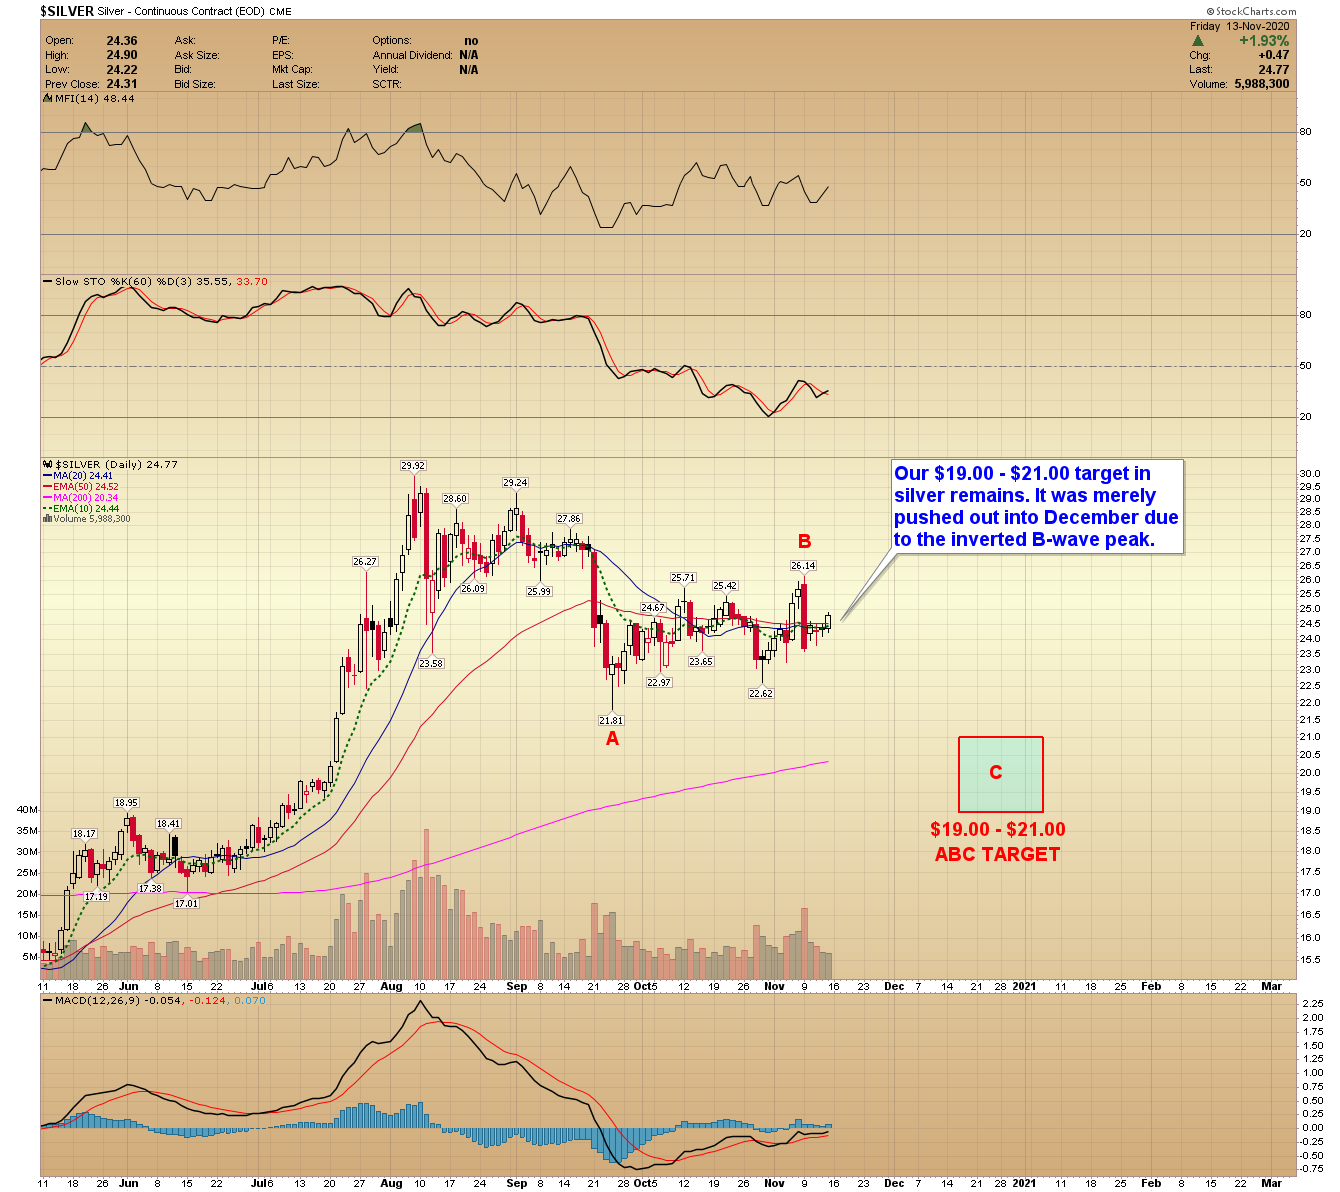
-SILVER- Our $19.00 – $21.00 target in silver remains. It was merely pushed out into December due to the inverted B-wave peak.
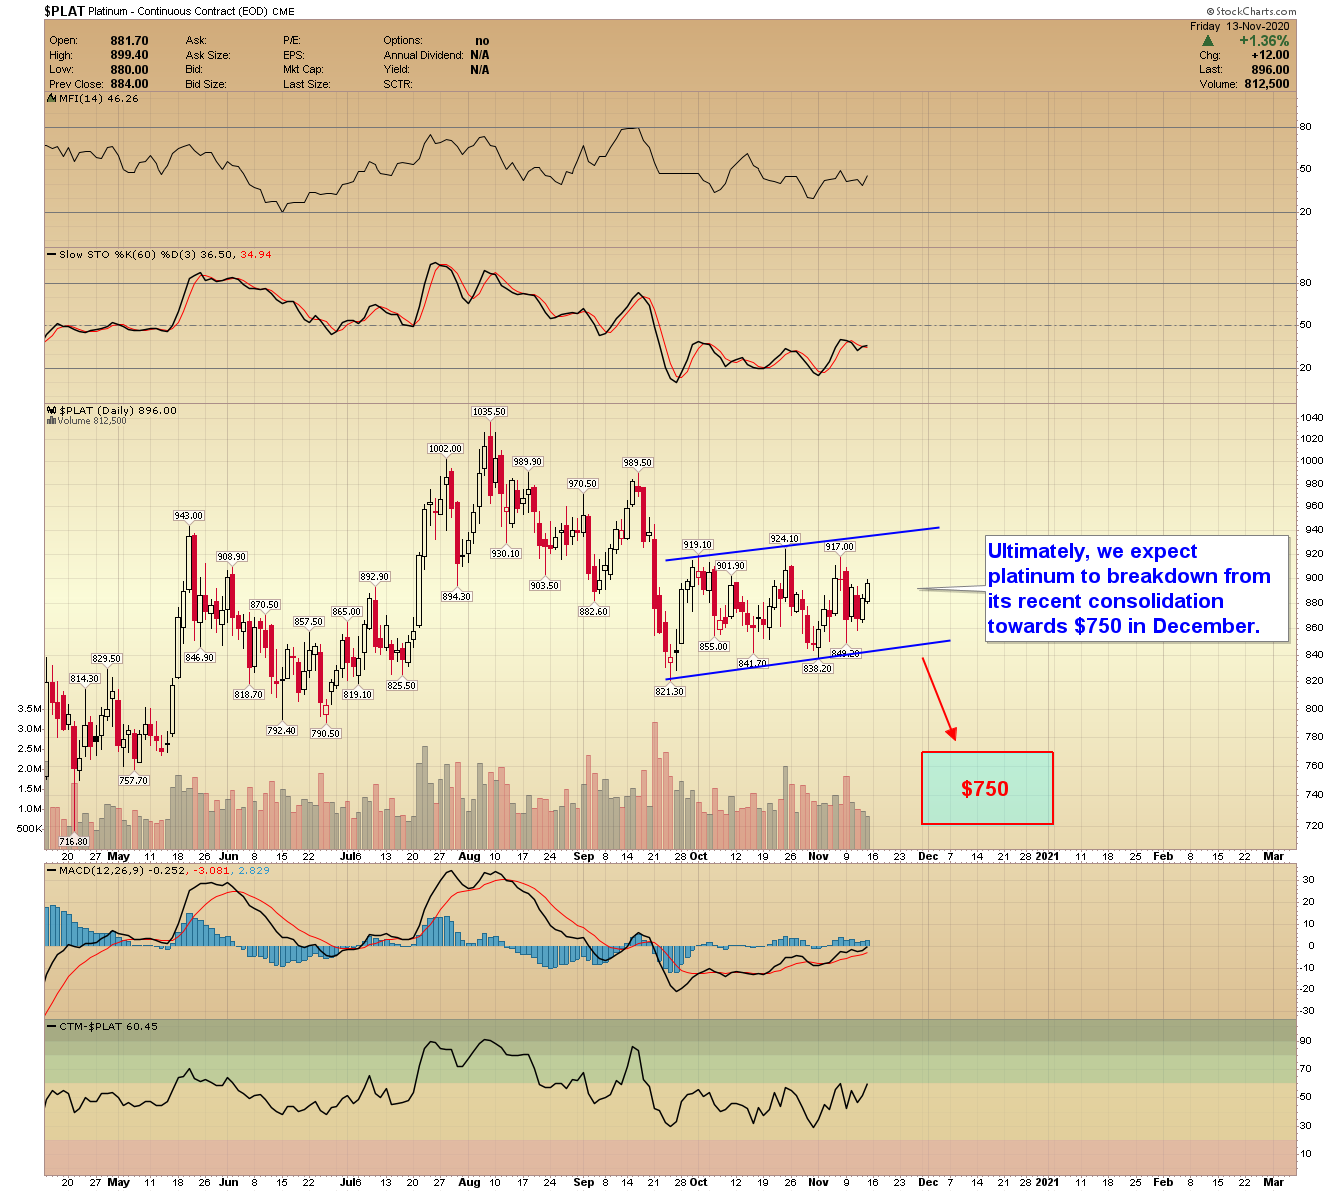
-PLATINUM- Ultimately, we expect platinum to breakdown from its recent consolidation towards $750 in December.
-GDX- The near-term price swings in miners have been incredibly volatile and unpredictable. That is likely to continue into December when we think a sustainable low is more likely.

-GDXJ- Because of the inverted November cycle, we had to move our target box out into late December. I think prices could drop as low as $42.00.

-XLE- Energy has been outperforming over the last two weeks, and prices are approaching the 200-day MA. I still see the potential for a double bottom – if we get lockdowns and a double-dip recession. I remain very bullish on energy and will continue to add aggressively to my personal portfolio if prices decline.

Have a great weekend, and be safe.