Much of the stimulus money sent out to Americans has made its way into the stock market. This is creating the divergence we see between “the markets” and the “real economy.” The bubble in stocks could end badly, for some investors.
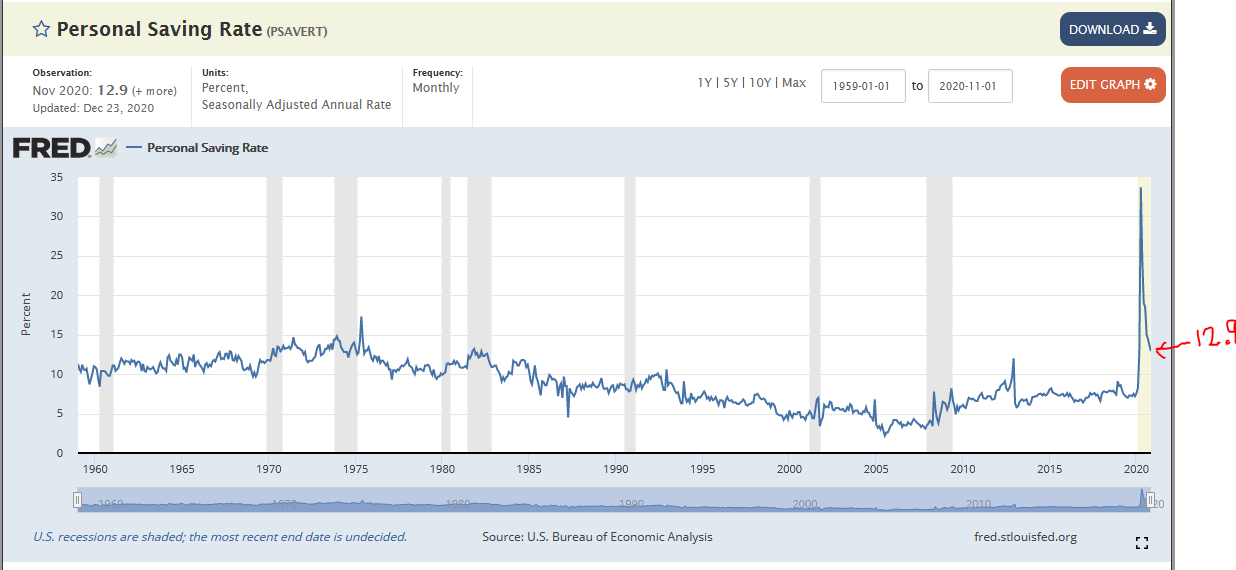
In April 2020, the personal savings rate for Americans spiked to a record 33.7%. It has come down since but remains high at 12.9% as measured in November. It has probably ticked up since the last round of stimulus and could exceed 20% in Q1 if Biden sends out an additional $1400.
A lot of that money has been flowing into disruptive sectors like electric vehicle stocks, battery technology, and cryptocurrencies. Investors “buy the story,” and valuations metrics like earnings take a back seat. Novice investors rush headlong into the rapidly rising markets…not knowing what awaits them.
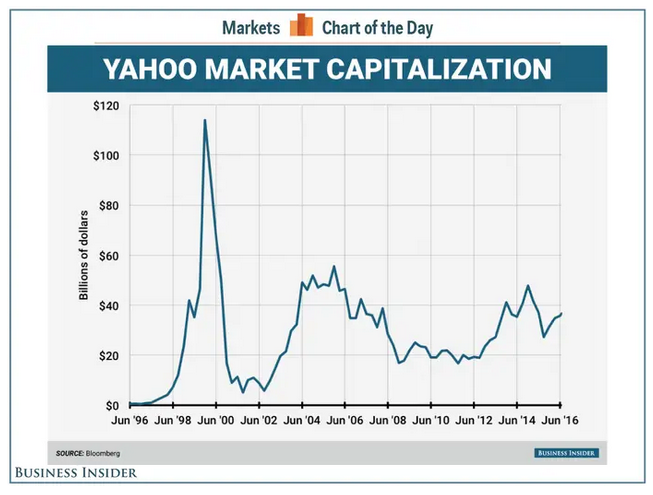
We saw a similar disruptive theme in the late 1990s during the dot.com bubble. At that time, any internet or e-commerce stock exploded higher in speculation – valuations and earnings meant nothing. One of the leaders back then was Yahoo. In the chart below, you’ll see Yahoo’s market cap explode to $116-billion from 1996 to 1999 before crashing back to $8-billion in 2001.
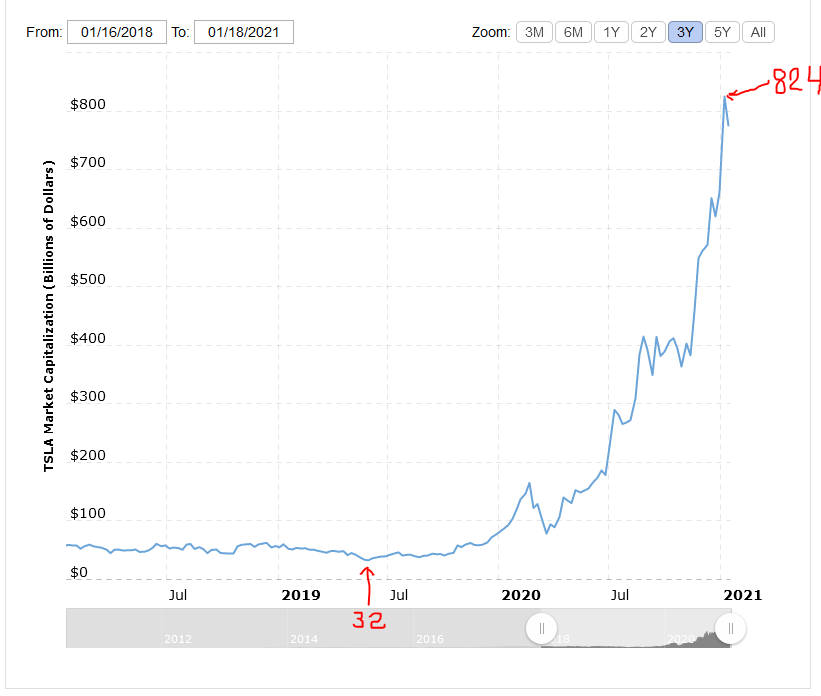
The market capitalization of Tesla has exploded similarly. In May 2019, Tesla’s market cap was $32-billion. Earlier this month, it hit $824-billion – an increase of 2400% in just 20-months.
How long will the bubble in stocks last? The answer depends on two factors: stimulus and the next market shock.
STIMULUS: If Biden pushes through an additional $1400 to the same income brackets as before, then speculative markets could continue to surge into the first half of 2021. However, I see several dark clouds on the horizon that could easily lead to a market shock (see below).
MARKET SHOCK: The coronavirus remains a serious threat globally. We are actually beginning to see an uptick in China. There are also reports that dozens of the elderly have died in Norway after receiving the first Pfizer shot. Not to mention escalating political tensions in the US and China. A significant news event or a series of smaller ones could lead to a quick and sharp selloff. As novice retail traders (Robinhooders) see profits dwindle, we could see a stampede to the exits.
What does all this mean for Gold? Great question! All the liquidity and money printing is very bullish for gold, long-term. But in the near-term, money could continue to flow into the more speculative sectors, while optimism remains high.
It is easy to get discouraged when you see prices exploding higher in one sector while yours is going nowhere. I assure you, this will not last forever. Eventually, the liquidity that we see going into stocks will shift to precious metals (that shift may have already started in platinum). Precious metals will have their turn – now is the time to be accumulating, in my opinion.
The gold cycle indicator finished the week at 44 and within maximum bottoming. This is considered a long-term buying zone.
*Premium Members: I will allocate the remaining cash reserves for the educational portfolio if/when the GCI reaches the maximum bullish reading of zero.
-US DOLLAR- The dollar is bouncing after becoming incredibly oversold. Prior rebounds have stalled just above the 50-day EMA. Consequently, a rebound towards the 92.00 level is possible. Longer-term, I expect the dollar to continue lower in 2021 as the budget deficit explodes.
-GOLD- Gold closed back below the 200-day MA, which opens the door for a repeat of the November pattern. Next week, closing below $1817 would likely extend this decline into the final week of January to form a double or perhaps undercut low. To erase the potential for a short-term breakdown, gold needs to close back above $1880 quickly. Again, many potential trigger events are looming that could turn gold higher in an instant. The key now is to be accumulating, in my opinion.
Note- The days surrounding January 27 are of particular interest if prices continue lower.
-SILVER- Silver needs to close above $26.00 to invalidate the recent bear flag. Otherwise, it looks like prices will dip back towards $22.50 to test the rising 200-day MA. If prices stay above the September low ($21.81), as I suspect, then silver and platinum should continue to lead gold higher in 2021.
-PLATINUM- Platinum bottomed back in September, and I see the potential buds of speculation. If speculators turn their sights to platinum, prices could explode. Momentum and higher prices will signal the herd of speculators. A breakout above $1200 will establish this outlook. In the meantime, a pullback towards the $1000 level is possible.
-GDX WEEKLY- The gold-mining ETF GDX broke out above the $29.00 – $31.00 base in April 2020. Prices are pulling back, and we could see a retest of that support zone – I expect it to hold. It would take a sustained breakdown below $29.00 to suggest a more severe multi-month correction.
-GDX DAILY- Friday’s close below $35.00 supports a short-term break down in miners. Prices could drop another 5 to 7-trading days and bottom during the last week of January. An undercut of the $33.00 low is likely with the potential for a brief spike to $31.00 or lower. Prices would have to close back above $36.00 next week to cancel the bearish potential.
-GDXJ- Juniors are also setting up for a potential double bottom or undercut low. In this scenario, prices should bottom in the last week of January.
-SILJ- Junior silver miners could pullback to the rising 200-day MA. As long as they stay above the September low ($12.60), the chart pattern remains very bullish.
-SPY- In 2020, the stock market collapsed over 35% and was back to new highs in less than 5-months. To the best of my knowledge, that has never happened before. What caused the miraculous reversal? An unprecedented amount of monetary and fiscal stimulus! Essentially, the government gave US citizens a lot of money to stay home and not work. That money is driving a speculative bubble in stocks. The market is vulnerable to a sharp correction with the next market shock.
-XLE- Energy is testing resistance around $45.00. I remain bullish on the sector and would like to buy the next pullback. If prices pullback from here, initial support arrives between $36.00 and $38.00. A deeper correction to $30.00 – $32.00 or lower is possible if lockdowns or stay-at-home orders return in February or March.
The US markets are closed Monday for Martin Luther King Day.
Have a safe and pleasant weekend.


