
The gold cycle indicator finished the week at 11. It dipped briefly to zero on Friday when gold reached $1759, but prices recovered before the US open. Consequently, we never reached an official zero reading during normal trading hours.

In this week’s newsletter, I’ll cover the Fed, Interest Rates, and Asset Bubbles briefly.
INTEREST RATES & THE FED
The preferred tool of the Fed to regulate economic growth is raising and lowering interest rates.
Fed Easing: When the economy is doing poorly, they lower interest rates and make borrowing easier to stimulate economic growth.
Fed Tightening: When the economy is overheating, they begin to raise interest rates to control speculation and asset bubbles.
Currently, the Fed is “easing,” and excess liquidity has found its way into risky and highly speculative areas (Electric Vehicles and Cryptocurrencies).
Asset Bubbles
To make an asset bubble, and get the speculative juices flowing you need one of two ingredients.
1) An asset or sector that is considered “the way of the future.” Think internet stocks in the 1990s. It was a completely new sector, and there was nothing to compare it to. Startup companies with no profits or earnings sold at ridiculous valuations. Tesla’s P/E is currently around 1248. On the other side of the spectrum – Barrick Gold’s P/E ratio is below 12.
2) It has to be complicated, i.e., the vast majority of investors don’t know how it works (think bitcoin). Nevertheless, they see prices going up, so they assume the story must be true. Note- Bitcoin has both of the above ingredients.
Sadly, all bubbles end the same way – a major collapse. The most challenging aspect is timing.
A recent example is the 2000 to 2007 housing bubble. Back then, money manager Michael Burry shorted the housing market via mortgage-backed securities aggressively. However, the bubble extended longer than he envisioned, and he nearly failed before he was proved correct. I recommend watching “The Big Short,” if you haven’t seen it (caution rated R). Currently, Burry is short Tesla and believes prices could drop 90% when the trend finally cracks.
Grand Super Cycle
Commodities reached a 100-year low versus stocks last year. I believe that triggered a generational shift where commodities (things) will begin to outperform paper assets (not things), especially bonds. If I’m correct about this “generational shift,” then we are in the beginning stages of a grand supercycle in commodities. Note- A grand supercycle can last up to 40-years. Now is NOT the time to be divesting from commodities.
GOLD BIG PICTURE UPDATE
I’m starting to see members turn bearish on gold. To me, that suggests we are nearing an emotional inflection point. It’s critical to remind ourselves of the big picture. The monthly gold trend remains in a bull market. I think you will find the next chart comforting.
GOLD MONTHLY TREND CHART: I like to turn to the monthly gold chart for a big picture perspective. Looking at the top indicator, you’ll see this is the first Monthly Stochastics dip below 80 in a new bull market. We had a similar setup in 2003 when gold dropped to $320, which turned out to be a superb buying opportunity. I believe the same is true now.
The 20-Month Average: In bull markets, gold prices should hold above the rising 20-month average (currently $1700). The only exception is when prices dip into an 8-year low (like 2008). Note- The next 8-year low isn’t due until 2024.

10-Year Treasury Yields: Interest rates for 10-year treasuries have been rising since the August low. Coincidentally, August is when gold prices started a multi-month correction. Does this mean gold will continue to decline if interest rates rise? No. Interest rates rise for two reasons.
1) Robust Economic Growth
2) Increasing Inflation Expectations
Currently, the market is pricing in superb economic growth, and that’s why gold has lagged. I think inflation is the primary driver behind increasing rates which is will ultimately prove positive for gold.

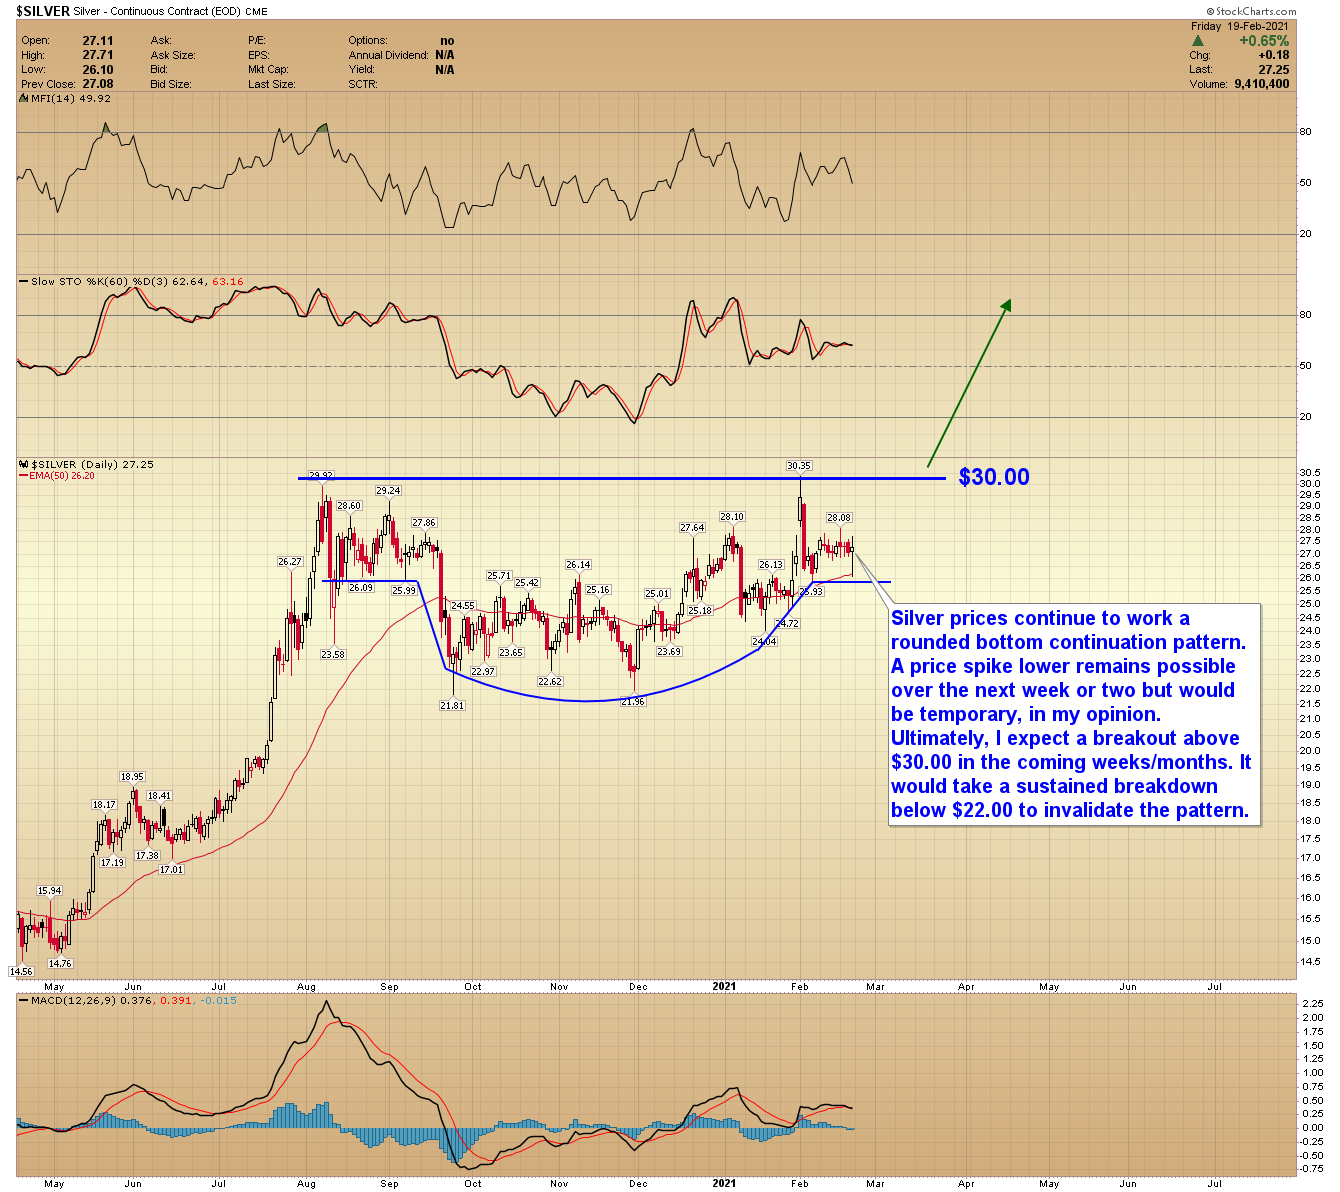
If silver and platinum were plummeting to new lows, I’d be concerned. They’re not. Just this week, platinum reached new multi-year highs. Silver is also holding firm, and a breakout above $30.00 would support a rally to $40.00+ in 2021.
DAILY CHART ANALYSIS
-GOLD- Gold is testing support around the $1765 level. A temporary breakdown remains possible. However, I see significant support between $1700 and $1765. Note- Prices are almost back to the pre-Covid levels; I’d be surprised if they here long.

-SILVER- Silver prices continue to work a rounded bottom continuation pattern. A price spike lower remains possible over the next week or two but would be temporary, in my opinion. Ultimately, I expect a breakout above $30.00 in the coming weeks/months. It would take a sustained breakdown below $22.00 to invalidate the pattern.
-PLATINUM- As I said earlier, if platinum and silver were plummeting to new lows, I’d be more concerned about gold. Platinum reached $1348 last week and new multi-year highs. In my opinion, this supports a new bull market in platinum.

-GDX- Gold miners are nearing significant price support surrounding $30.00. A temporary spike lower remains possible, especially if the general stock market declines sharply. I consider buying anywhere near pre-Covid levels (GDX opened 2020 at $29.20) as an excellent long-term opportunity.

-SPY- The stock market continues to trace out a near picture-perfect pattern to 12-months ago. Consequently, a sharp decline in the not-too-distant future remains a possibility. Closing below the 385 pivot level would support this outlook. Note- A sharp decline in the stock market could exacerbate selling in gold or miners temporarily.

-XLE- The XLE is holding above the $45.00 level, but the diverging MACD (bottom) suggests prices could be nearing a correction. Progressive closes back below $45.00 would support a multi-week pullback.

-WTIC- Oil formed a swing high after spiking to $62.29. Progressive closes back below the 10-day EMA (currently $58.81) would establish an interim top and multi-week pullback.

A spike low in precious metals and miners is possible in the coming days. Longer-term, however, I believe we are in the beginning stages of a grand supercycle. Focusing on the long-term trends guards investors against near-term emotional mistakes.
Have a great weekend.