
Gold, Silver, and Miners are moving within a larger correction pattern, and prices will eventually break lower.
I wanted to spend some time explaining why I continue to look lower in precious metal prices. The majority of the Thursday report will be spent illustrating the positive correlation between the Japanese Yen and gold prices. Hopefully, this information will prove useful in helping you understand why I think gold has further to correct. I will finish with quick summaries of Gold, Silver, and GDX.
The Yen Suggests Gold Prices Have Further To Drop
The US Dollar is widely known for its inverse correlation to precious metal prices. The reserve currency of the world appreciates in value and commodities priced in dollars drop. Another currency used for correlation purposes is the Japanese Yen. It frequently has a positive relationship to gold. Before we delve into the Yen, let me give a brief description intermediate cycles.
Intermediate Cycles
Intermediate cycles are measured in weeks between troughs or bottoms. As a cycle analyst, I search for definable cycles that we can exploit for a profit. Once a cycle is clearly defined, we use it for timing our investments and for other technical studies.
The typical intermediate cycle in the Yen lasts approximately 50-Weeks between bottoms. We are now in the 44th week of the current reporting period, and the Yen should begin dropping into a significant low. During an uptrend Yen prices tend to bottom just below the 50-week EMA. Currently, prices are trading at 99.12. Cycles suggest the Yen should drop to approximately 92.50 or lower in the coming weeks.
-WEEKLY YEN PRICE CHART- The Japanese Yen has been showing a high correlation to gold. The Yen peaked in October of 2011, just a few weeks after gold and then began a multiyear decline. In late 2015 the Yen produced a failed cycle (unable to make a lower low), and thus marked a pivotal turning point. Precious metals have rallied with the Yen throughout all of 2016, and are seriously overdue for a correction. For this reason, I continue to look lower in gold.
The Yen appears to have peaked in mid-August at the 39-week mark, just after gold. Few rallies continue past 39-weeks before a meaningful correction.

There is a lot of information to review in the above chart. The key takeaway is the Yen is overdue for a correction below its 50-week EMA. Average cycle duration advises the Yen should bottom in late October. However, if this series extends out to 60-weeks, as it occasionally does, prices, in that case, won’t bottom until early January.
Conclusion
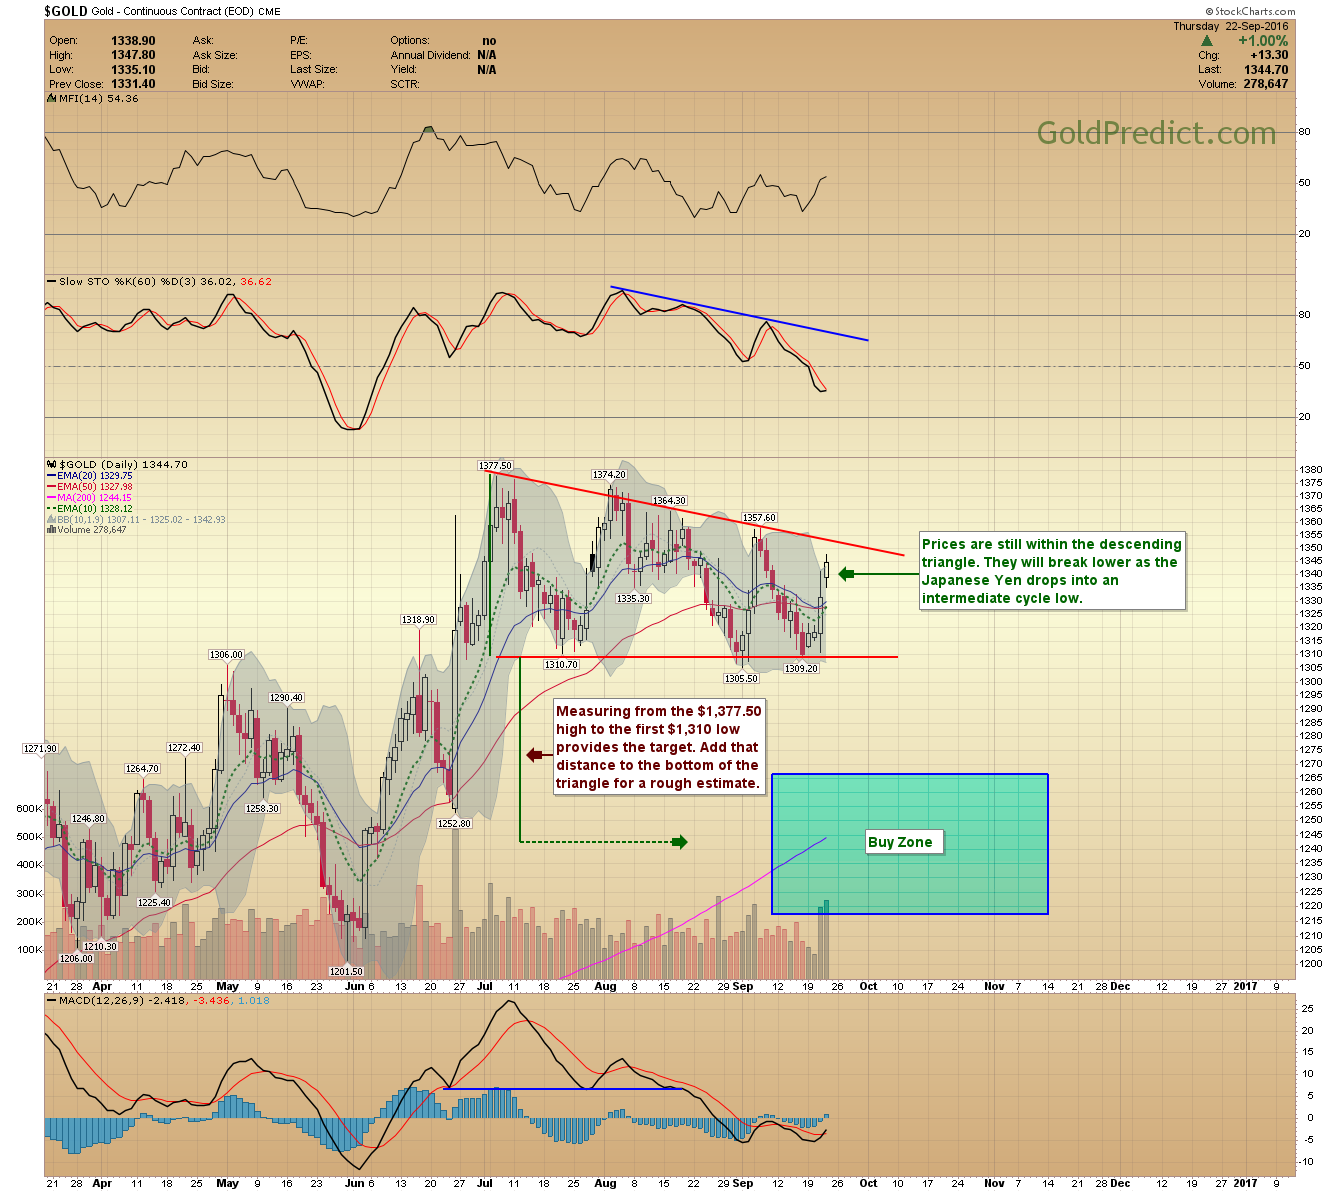
Precious metals are in a correction phase; the upside is limited. Gold will drop with the Yen and the next buying opportunity in precious metals will arrive once the Yen bottoms beneath its 50-week EMA. The descending triangle formation in gold targets just under $1,245.00.
Regular Charts
-GOLD- Prices are still within the descending triangle. They will break lower as the Japanese Yen drops into an intermediate cycle low.
-SILVER- Silver could rally a bit further, but I expect them to stay below the previous common cycle peak of $21.83 before rolling over.

-GDX- Prices may have topped today, or they could rally as high as $30.50. Nevertheless, I’m still expecting prices to drop further before making a significant bottom.

The Buy Zones are still active. I may have to extend their time-frames out to January but the depth of correction remains the same.
Enjoy your weekend