
THE TALE OF TWO CYCLES
We currently sit in a precarious position regarding the cycles I follow. The intermediate (6-month) gold cycle is the primary mechanism behind roughly 70% of our timing decisions and therefore a vital component of our system. Our medium-term outlook has fluctuated between bullish and bearish the last few weeks and I’d like to spend the Weekend Newsletter explaining why.
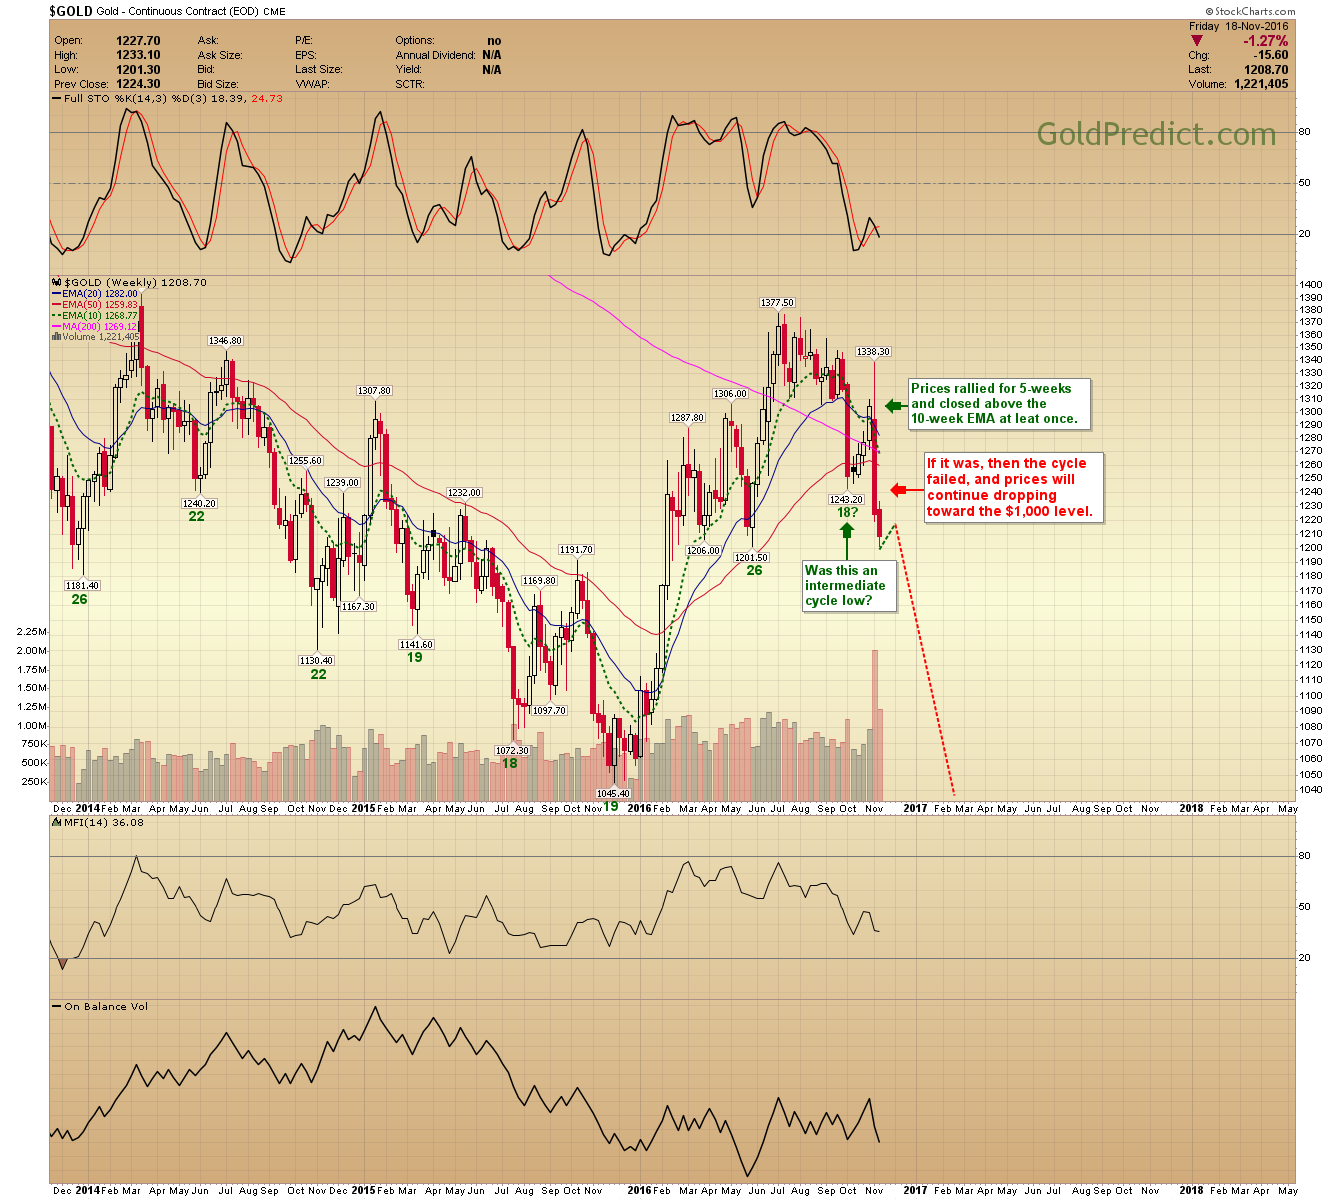
The price action throughout October and early November can be interpreted one of two ways. One, the move out of the $1,243 low was an extended oversold bounce in an ongoing intermediate-term correction and prices are very close to forming a lasting low. Or two, the move out of the $1,243 low was an intermediate cycle that failed after just 5-weeks, and prices will continue lower into the first quarter of 2017.
Each scenario has profound investing implications, and we don’t want to get it wrong. The first implies that the 8-year cycle bottomed December 3rd, 2015 at $1,045.40 and that prices are conceivably dropping into the last great buying opportunity before heading much higher. The latter proposes that the move to $1,377.50 was merely a bear market rally and that prices will drop swiftly from here into the real 8-year cycle low.
After combing through the data, there is the evidence supporting both views.
Supporting an 8-year cycle bottom in December of 2015:
- Gold rallied for 7-months out of the $1,045 low forming a bullish right translated cycle. Cycles are left translated in a bear market as prices continue to make lower lows.
- Gold made three higher closes above the 48-month exponential moving average (EMA). Standard confirmation for an 8-year cycle bottom.
- Gold prices exceeded the 2015 annual high (higher high). Not normal behavior in a bear market.
- Miners- The HUI rallied 188% off the 2016 low. I can’t think of any bear market rally in history that rallied nearly 200%.
- The Japanese Yen has traded hand-in-hand with gold since 2007, and prices appear to be very close to a significant low.
Views opposing an 8-year cycle bottom in December of 2015:
- It would mark the shortest 8-year cycle on record, arriving a full year early. Previous 8-year cycle lows arrived within a 6-month window surrounding a US Presidential election. Conventional timing supported an 8-year cycle arriving between August 2016 and February 2017.
- The HUI established a bearish head-and-shoulder topping pattern and has violated the May 25th 194.64 intermediate cycle low.
- Gold is currently testing its previous intermediate cycle low set May 31st at $1,201.50, and prices could break that level next week.
- We are still within the traditional timing window for the arrival of an 8-year cycle bottom.
- The commercial traders have dramatically reduced their short exposure from a record high of 463,942 in July 2016, down to 315,157. However, there is still room for improvement. Just before the December 3rd $1,045.40 low, their short exposure was only 158,465 contracts.
- We also watch the COT small speculator numbers. Small speculators usually get it wrong at major turning points. For example, the November 3rd, 2015 COT report showed 39,350 longs versus 30,704 shorts; predominantly bullish as prices dropped into the December 3rd low. However, those figures reversed near the $1,045 bottom, revealing 35,707 longs versus 42,546 shorts; bearish when the low arrived. Currently, the small speculators are bullish with a long exposure of 49,240 versus just 26,934 shorts.
-WEEKLY GOLD CHART- Let us now turn to the weekly gold chart. Here you will see intermediate cycles last anywhere from 18-weeks up to 26-weeks between lows (green numbers). From these lows, prices rally and close above the 10-week EMA thus confirming an intermediate cycle bottom. I like to see two higher closes above the 10-week EMA, but sometimes we only get one.

NOW THE DILEMMA
Did the October 7th $1,243.20 low mark an intermediate cycle bottom at 18-weeks? Technically speaking, prices fulfilled the minimum requirements needed to consider this a low, but barely. Prices bottomed at 18-weeks, rallied for 5-weeks, and there was at least one close above the 10-week EMA.
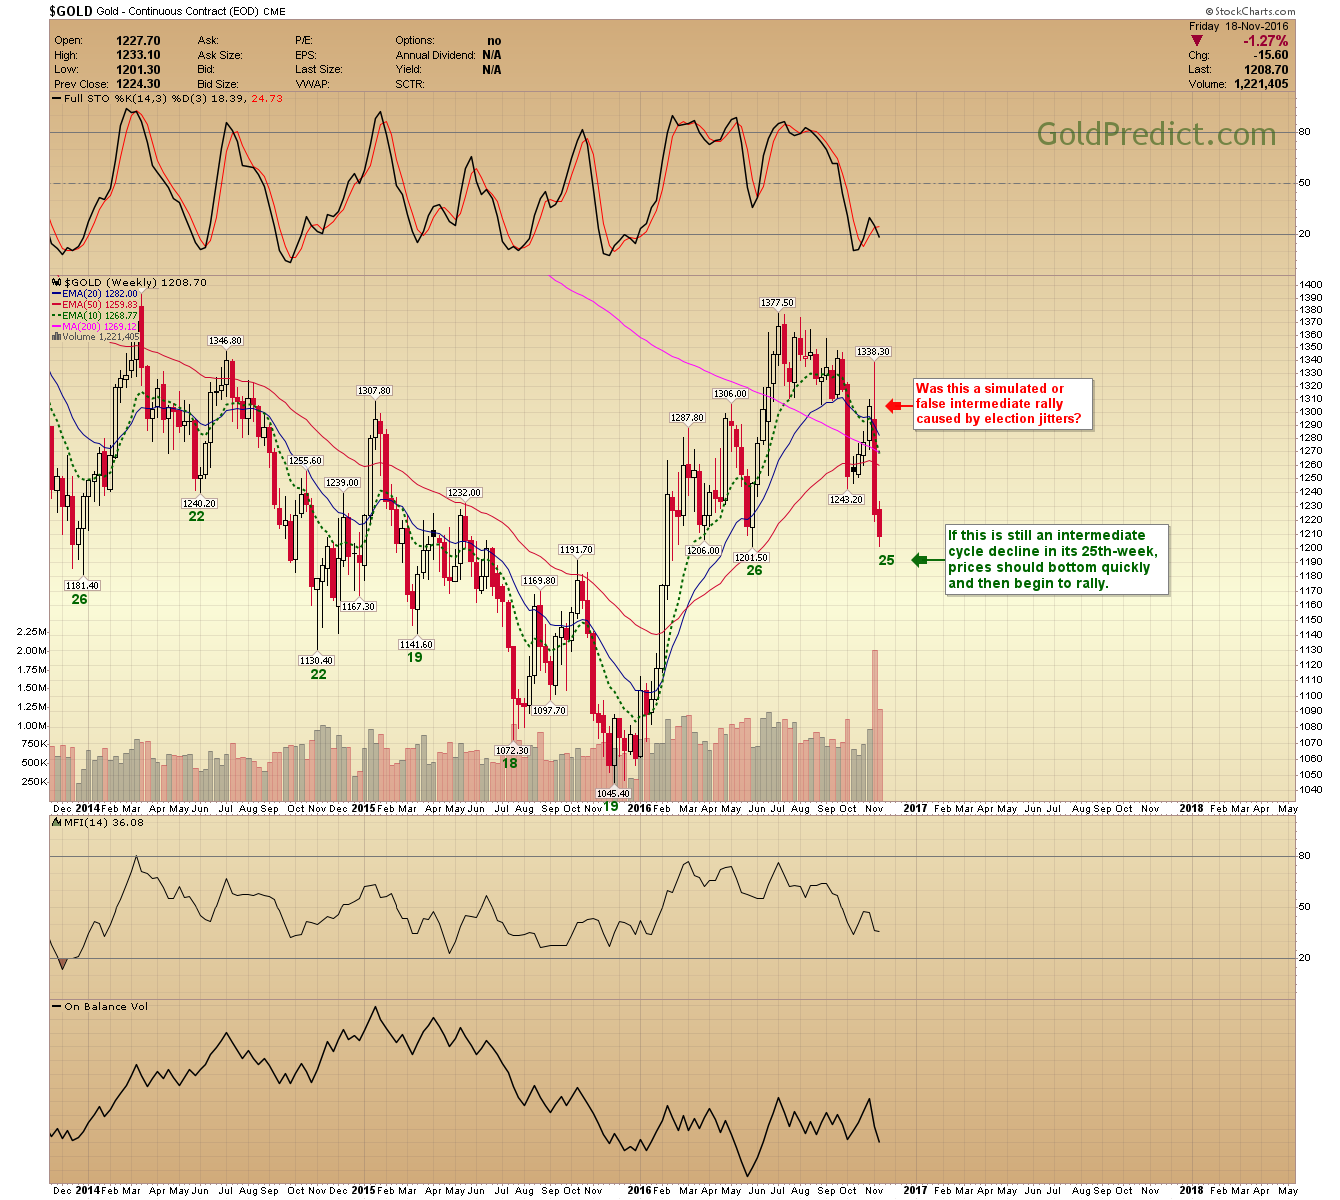
On the other hand, it’s possible the October rally was simply pre-election jitters that simulated an intermediate-term rally. If this is the case, then prices are still dropping into an intermediate cycle low, and at 25-weeks we should see a bottom quickly.
What should we do? Keep trading positions small and or wait until we know which is the correct cycle interpretation.
If we are still stuck an intermediate cycle decline, at 25-weeks. Then gold prices either bottomed last week or they soon will. It’s possible the big banks will try and run the stops below $1,200 to create a liquidity flush allowing them to enter large positions. In this event, I would expect to see a sharp decline followed by a rally back to the $1,200 level. Conversely, if prices don’t recover quickly from a sharp decline below $1,200, then the odds will increase that we are headed into the actual 8-year cycle low.
Nevertheless, prices will be higher 18-months from now and much-much higher 4-years from now. Prices falling further from here should be viewed as a gift.
Yes, our buy gauges are pegged in the excellent buy zones, but we need to proceed cautiously until we know which cycle is playing out.