
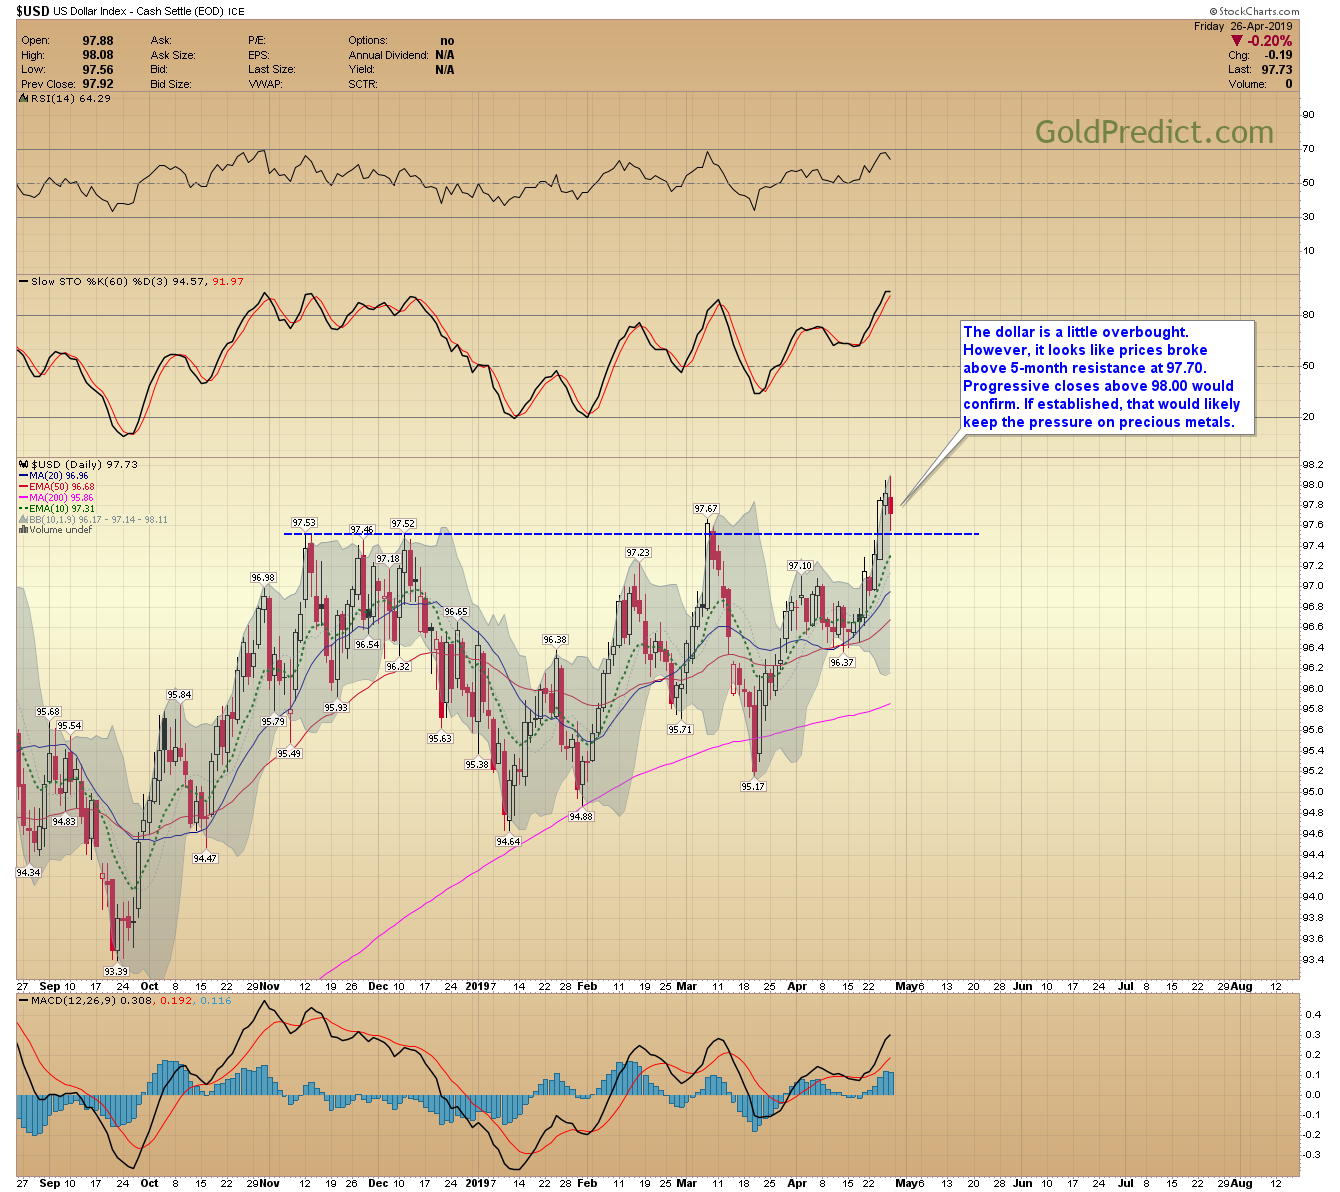
-US DOLLAR- The dollar is a little overbought. However, it looks like prices broke above 5-month resistance at 97.70. Progressive closes above 98.00 would confirm. If established, that would likely keep the pressure on precious metals.
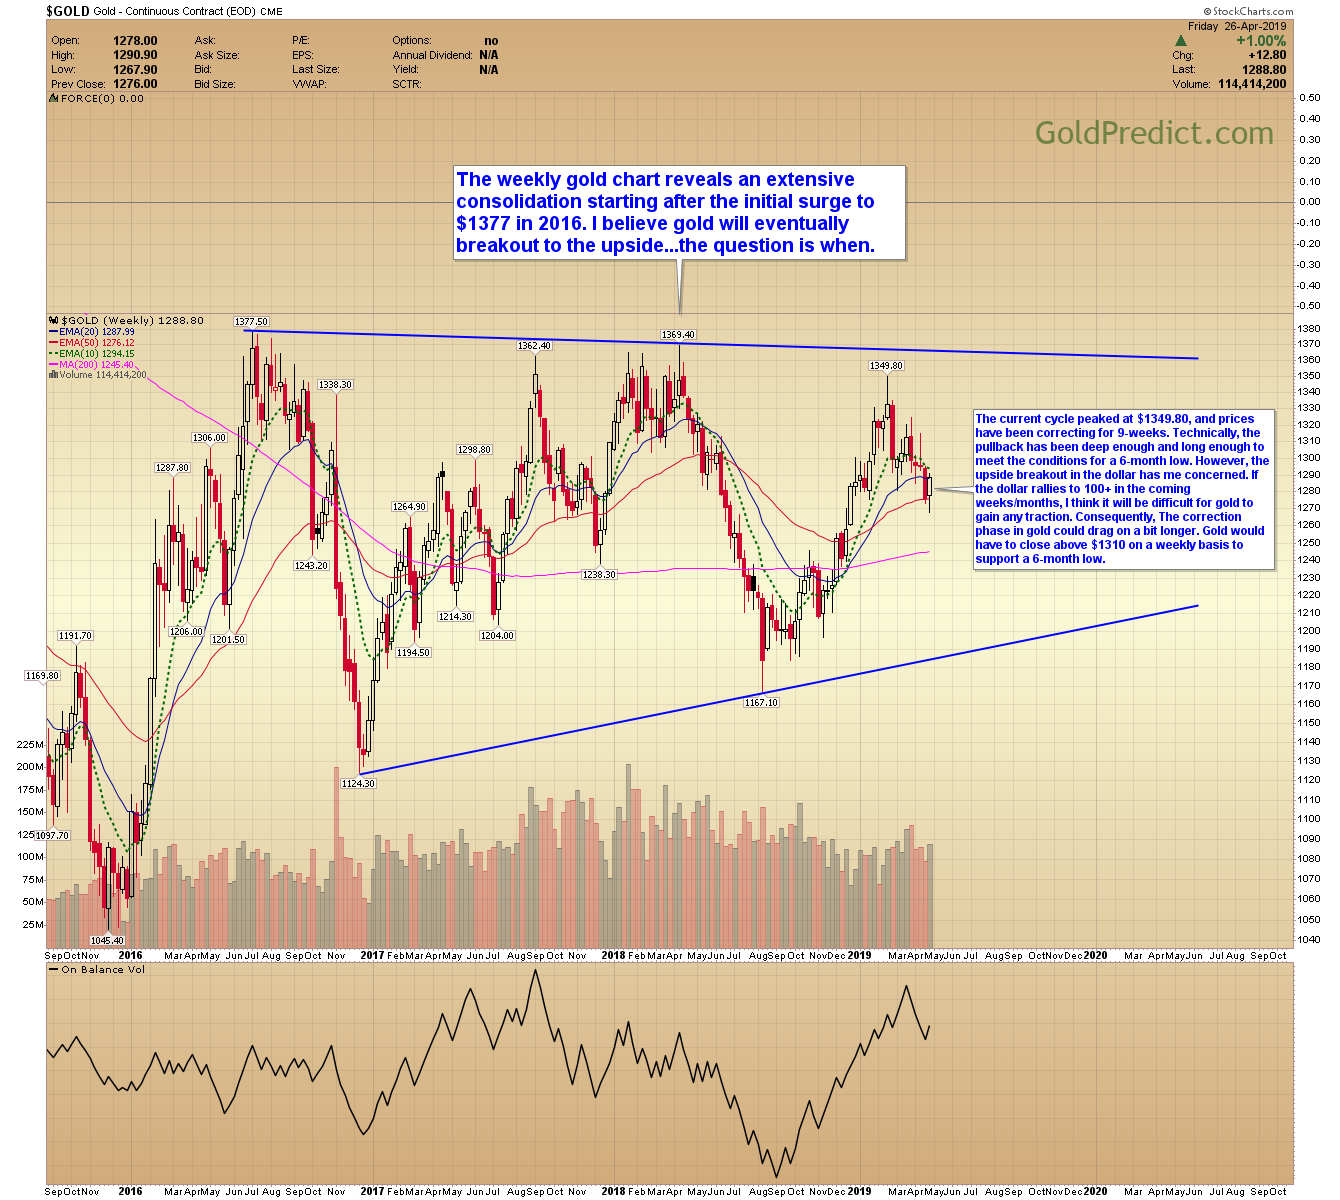
-GOLD WEEKLY- The weekly gold chart reveals an extensive consolidation starting after the initial surge to $1377 in 2016. I believe gold will eventually breakout to the upside…the question is when.
The current cycle peaked at $1349.80, and prices have been correcting for 9-weeks. Technically, the pullback has been deep enough and long enough to meet the conditions for a 6-month low. However, the upside breakout in the dollar has me concerned. If the dollar rallies to 100+ in the coming weeks/months, I think it will be difficult for gold to gain any traction. Consequently, The correction phase in gold could drag on a bit longer. Gold would have to close above $1310 on a weekly basis to support a 6-month low.
-GOLD DAILY- The daily chart of gold formed a swing low at $1267.90. If this is just a bounce, then prices should rollover between here and the short-term trendline near $1300. A decisive rally above $1310 would support a 6-month low.

-SILVER WEEKLY- The longer-term silver chart is forming a broad base around $14.00. Since 2016, each rally has been capped just above the flattening 200-week MA. A decisive breakout above $17.00 would signal the next significant upswing in silver prices.

-SILVER DAILY- The daily silver chart reveals a descending wedge formation that could produce an upside breakout. If established, I would expect a retest of resistance around $16.20. Breaking above $16.20 would recommend a test of the larger pattern trendline near $17.00.

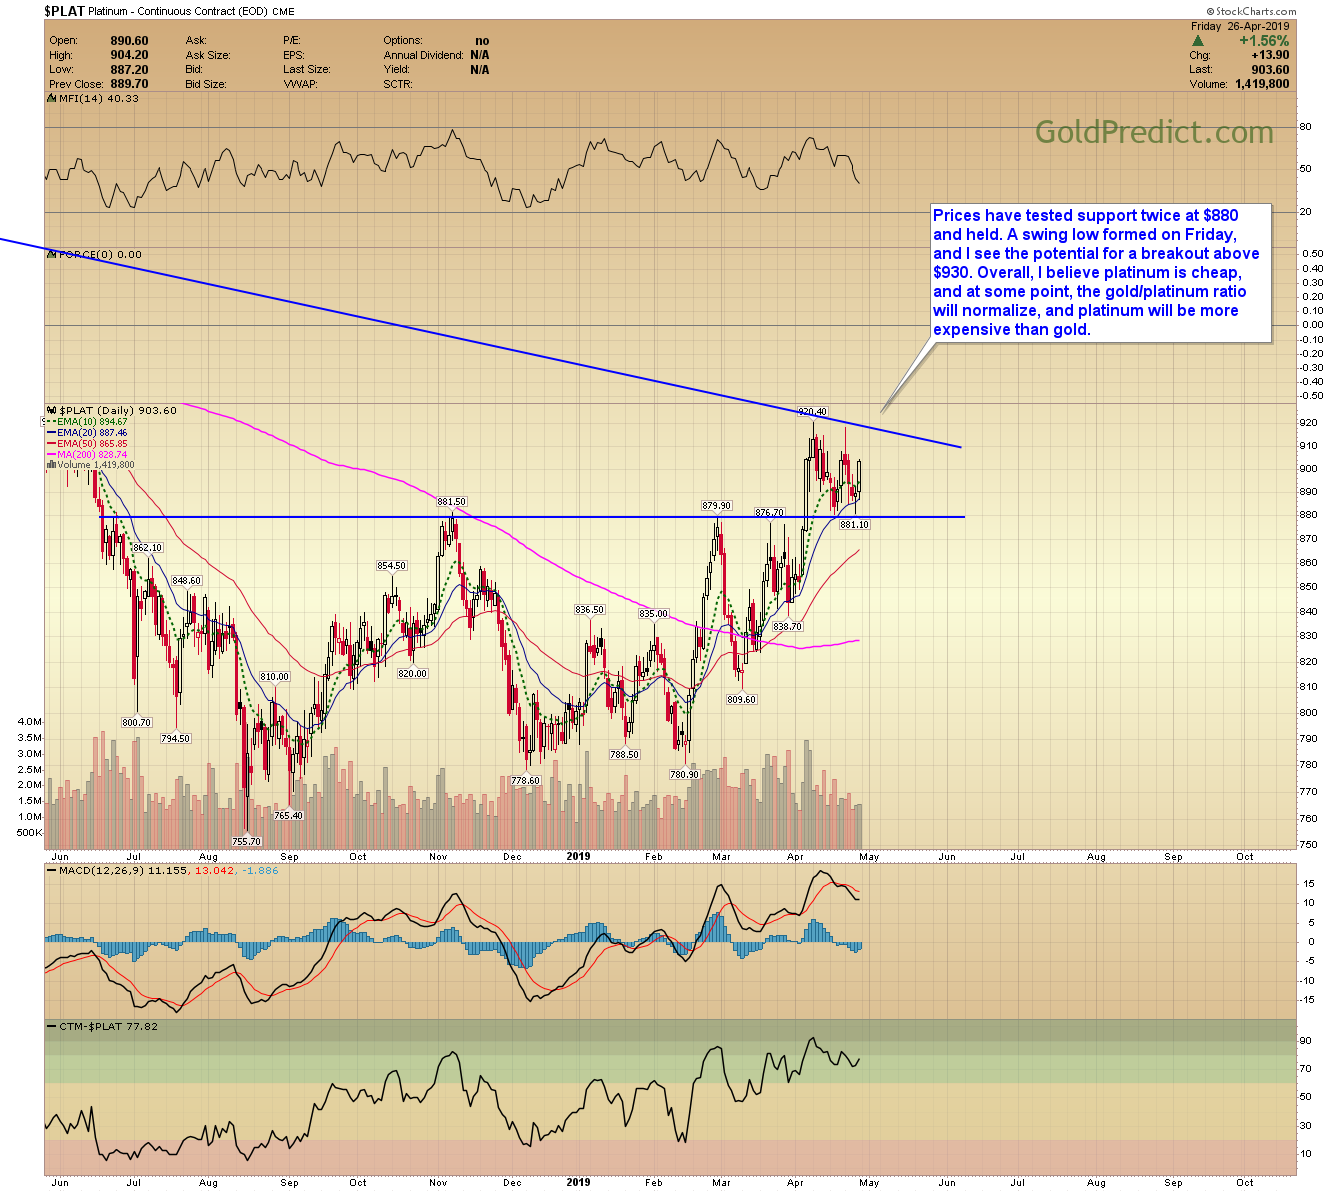
-PLATINUM- Prices have tested support twice at $880 and held. A swing low formed on Friday, and I see the potential for a breakout above $930. Overall, I believe platinum is cheap, and at some point, the gold/platinum ratio will normalize, and platinum will be more expensive than gold.
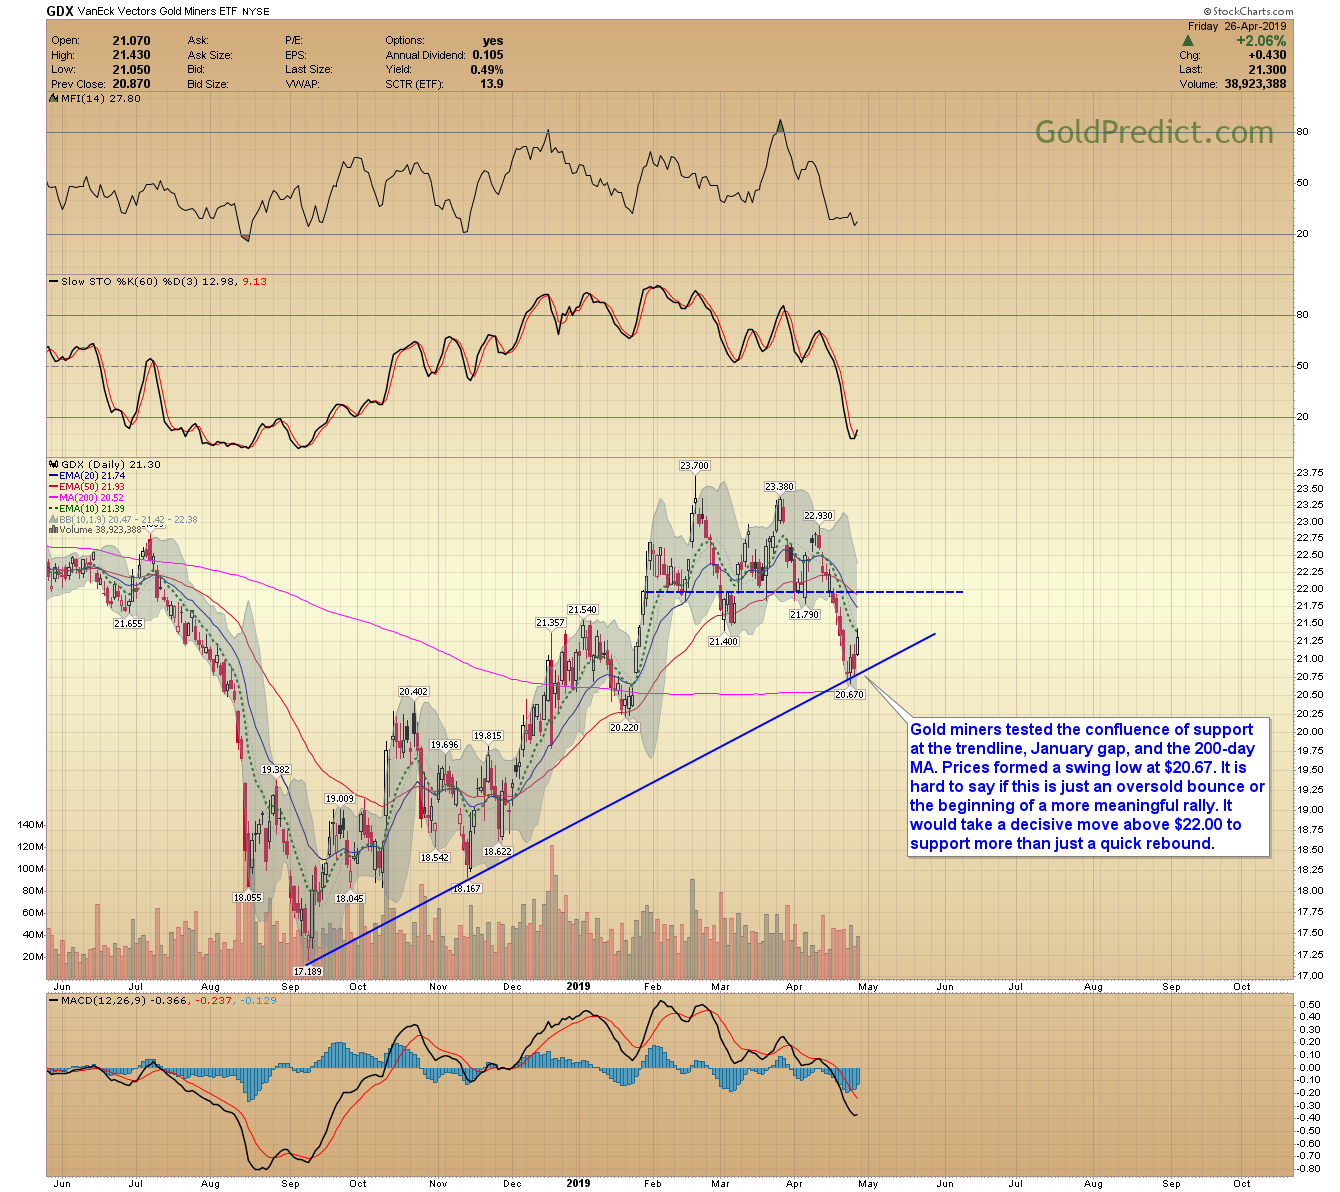
-GDX- Gold miners tested the confluence of support at the trendline, January gap, and the 200-day MA. Prices formed a swing low at $20.67. It is hard to say if this is just an oversold bounce or the beginning of a more meaningful rally. It would take a decisive move above $22.00 to support more than just a quick rebound.
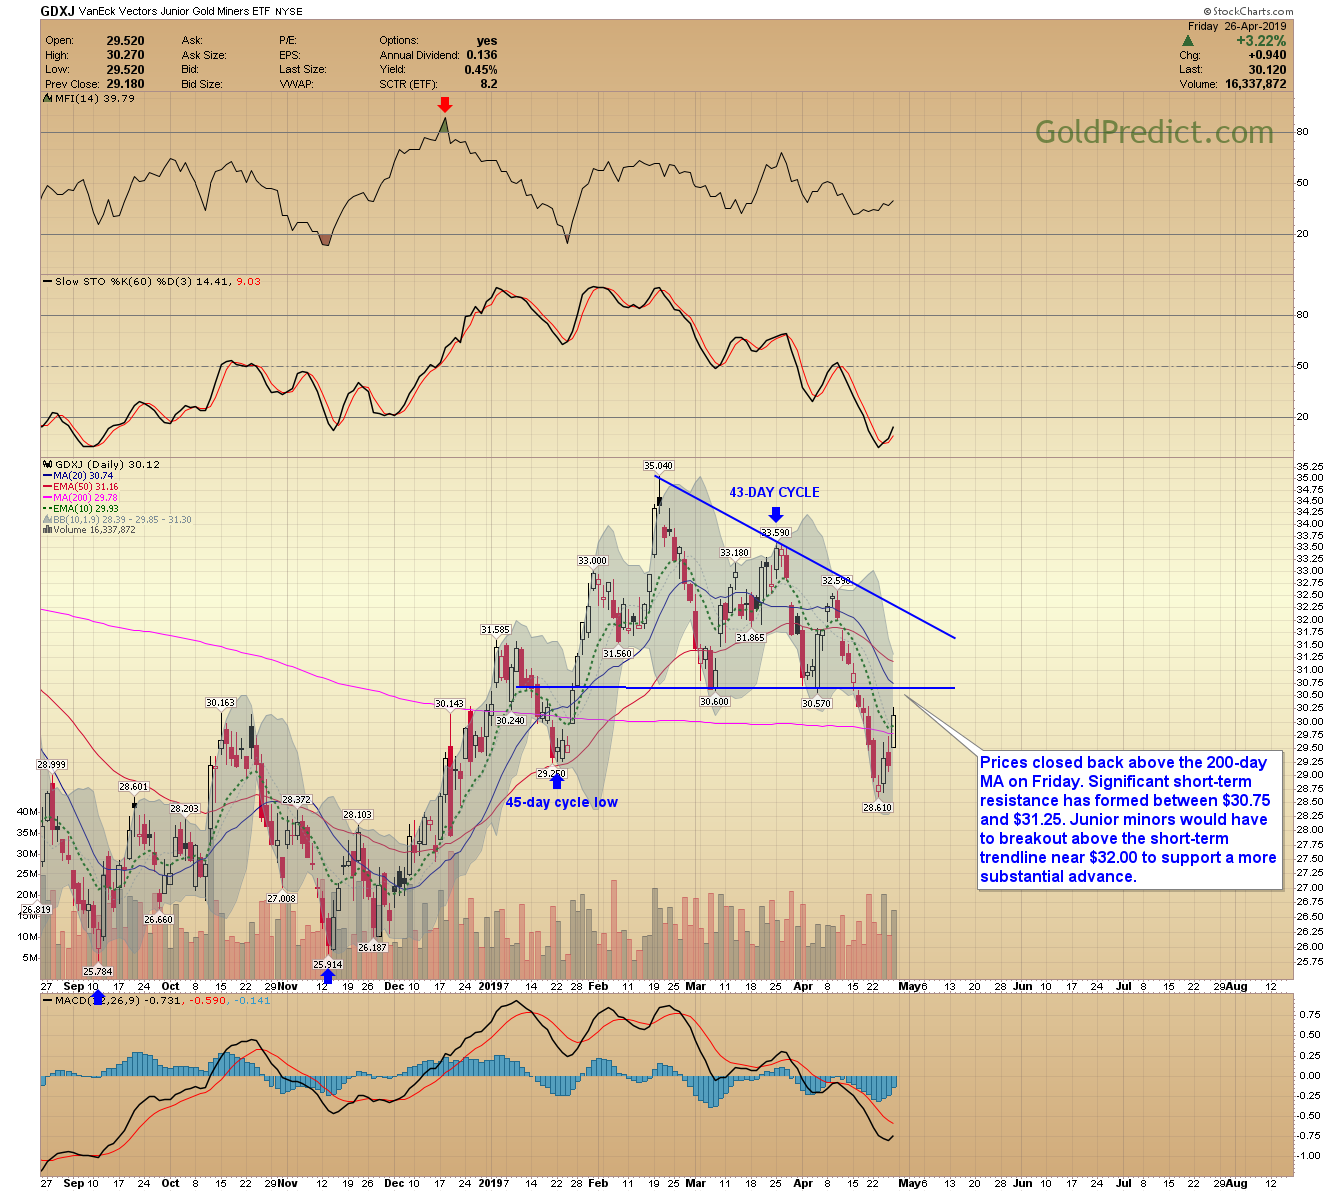
-GDXJ- Prices closed back above the 200-day MA on Friday. Significant short-term resistance has formed between $30.75 and $31.25. Junior minors would have to breakout above the short-term trendline near $32.00 to support a more substantial advance.
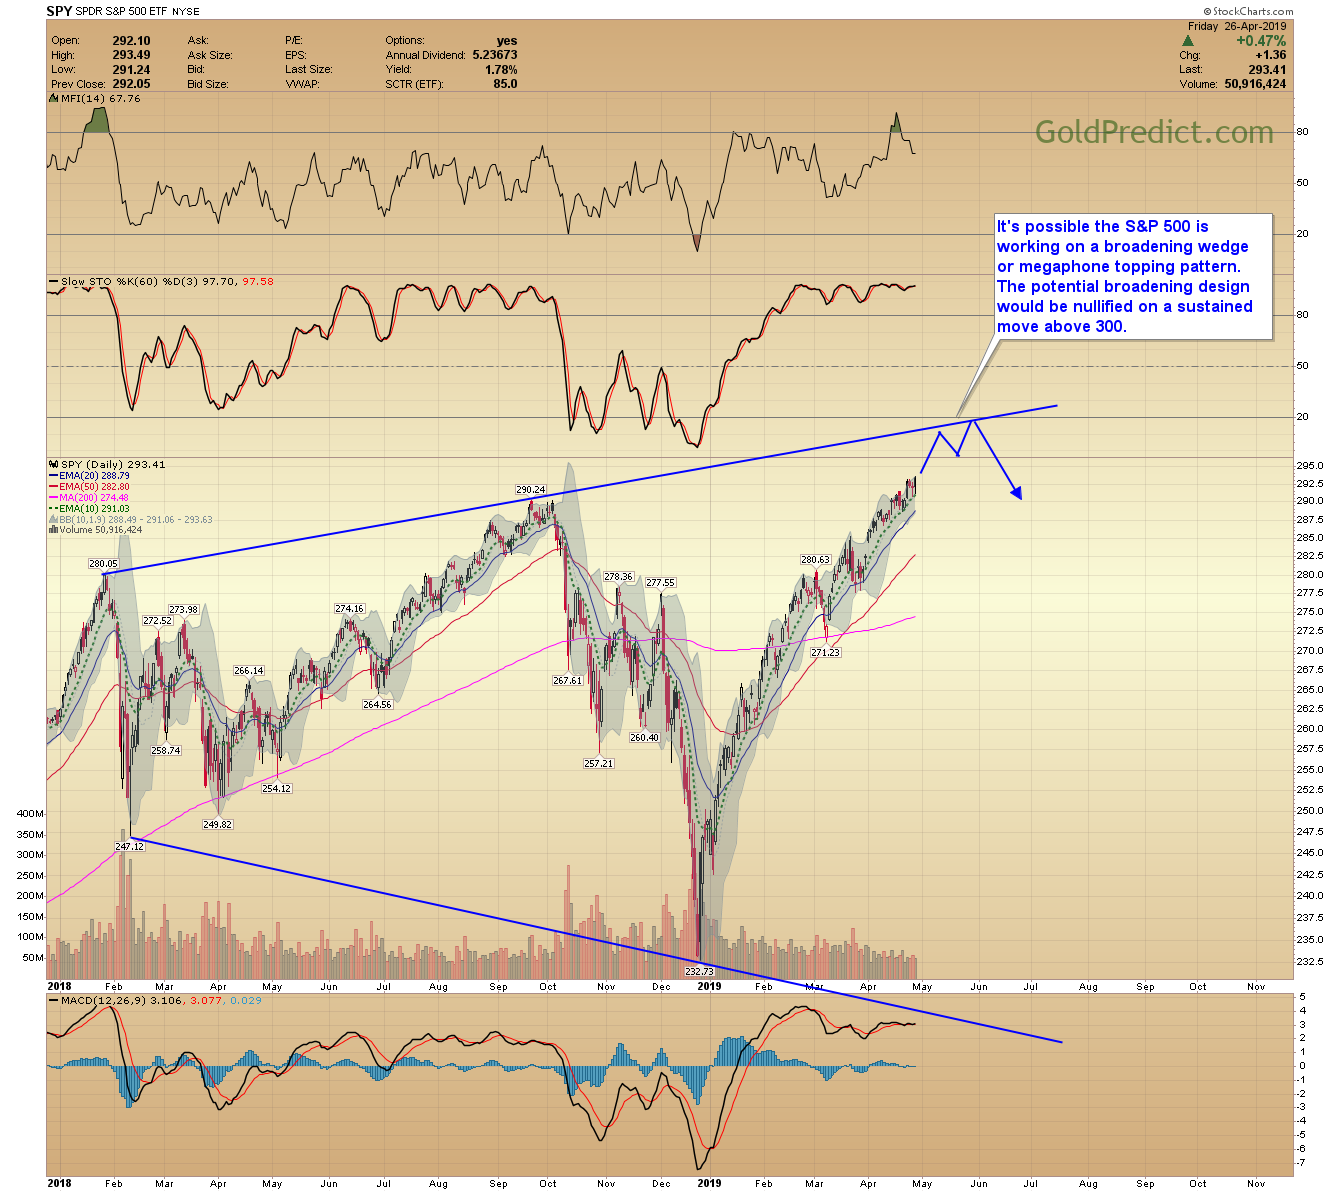
-SPY- It’s possible the S&P 500 is working on a broadening wedge or megaphone topping pattern. The potential broadening design would be nullified on a sustained move above 300.
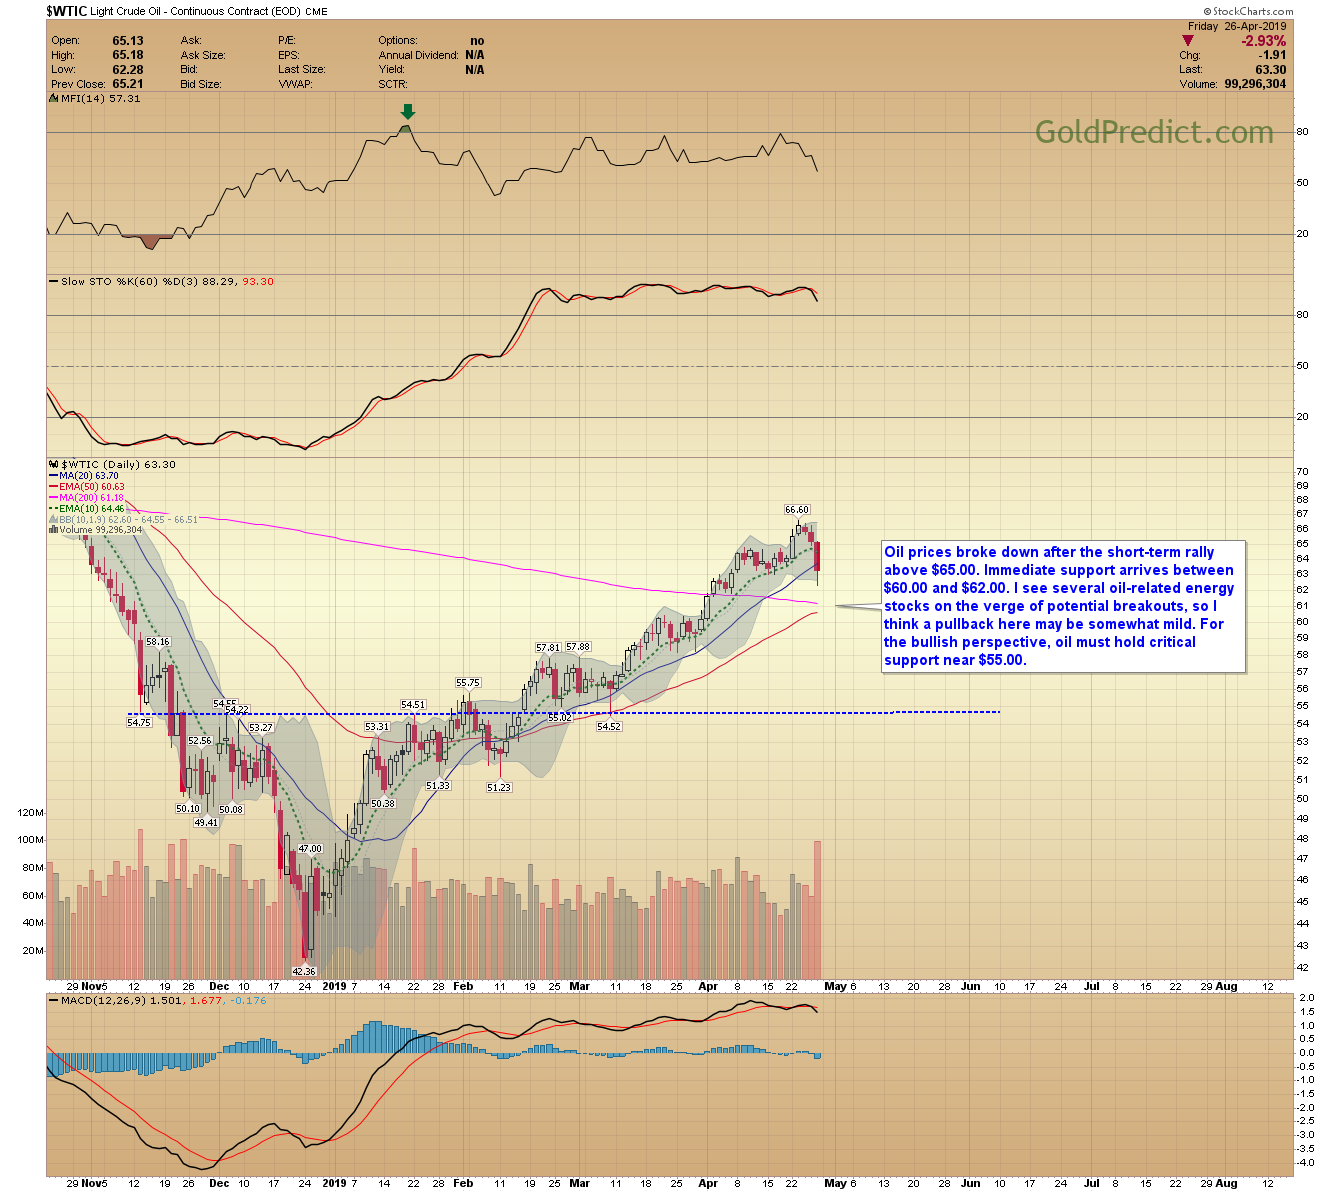
-WTIC- Oil prices broke down after the short-term rally above $65.00. Immediate support arrives between $60.00 and $62.00. I see several oil-related energy stocks on the verge of potential breakouts, so I think a pullback here may be somewhat mild. For the bullish perspective, oil must hold critical support near $55.00.
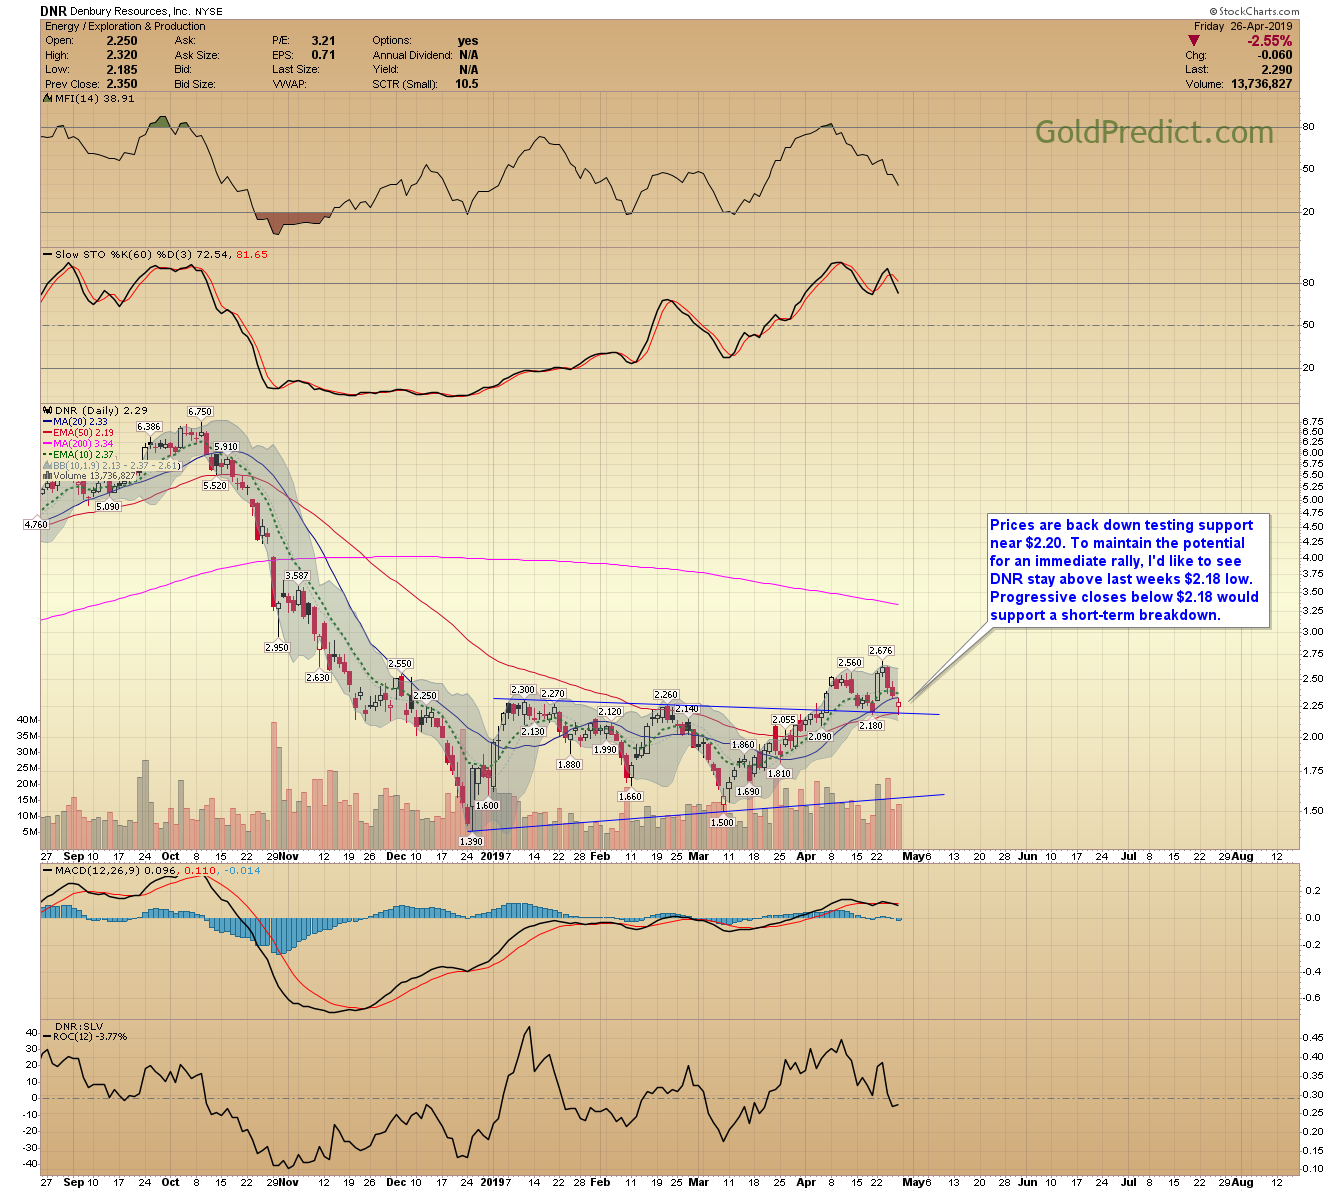
-DNR- Prices are back down testing support near $2.20. To maintain the potential for an immediate rally, I’d like to see DNR stay above last weeks $2.18 low. Progressive closes below $2.18 would support a short-term breakdown.
-HESM- The Hess midstream partners chart appears to be working on a variation of an inverse head and shoulder pattern. A daily close above $23.15 would support a breakout.

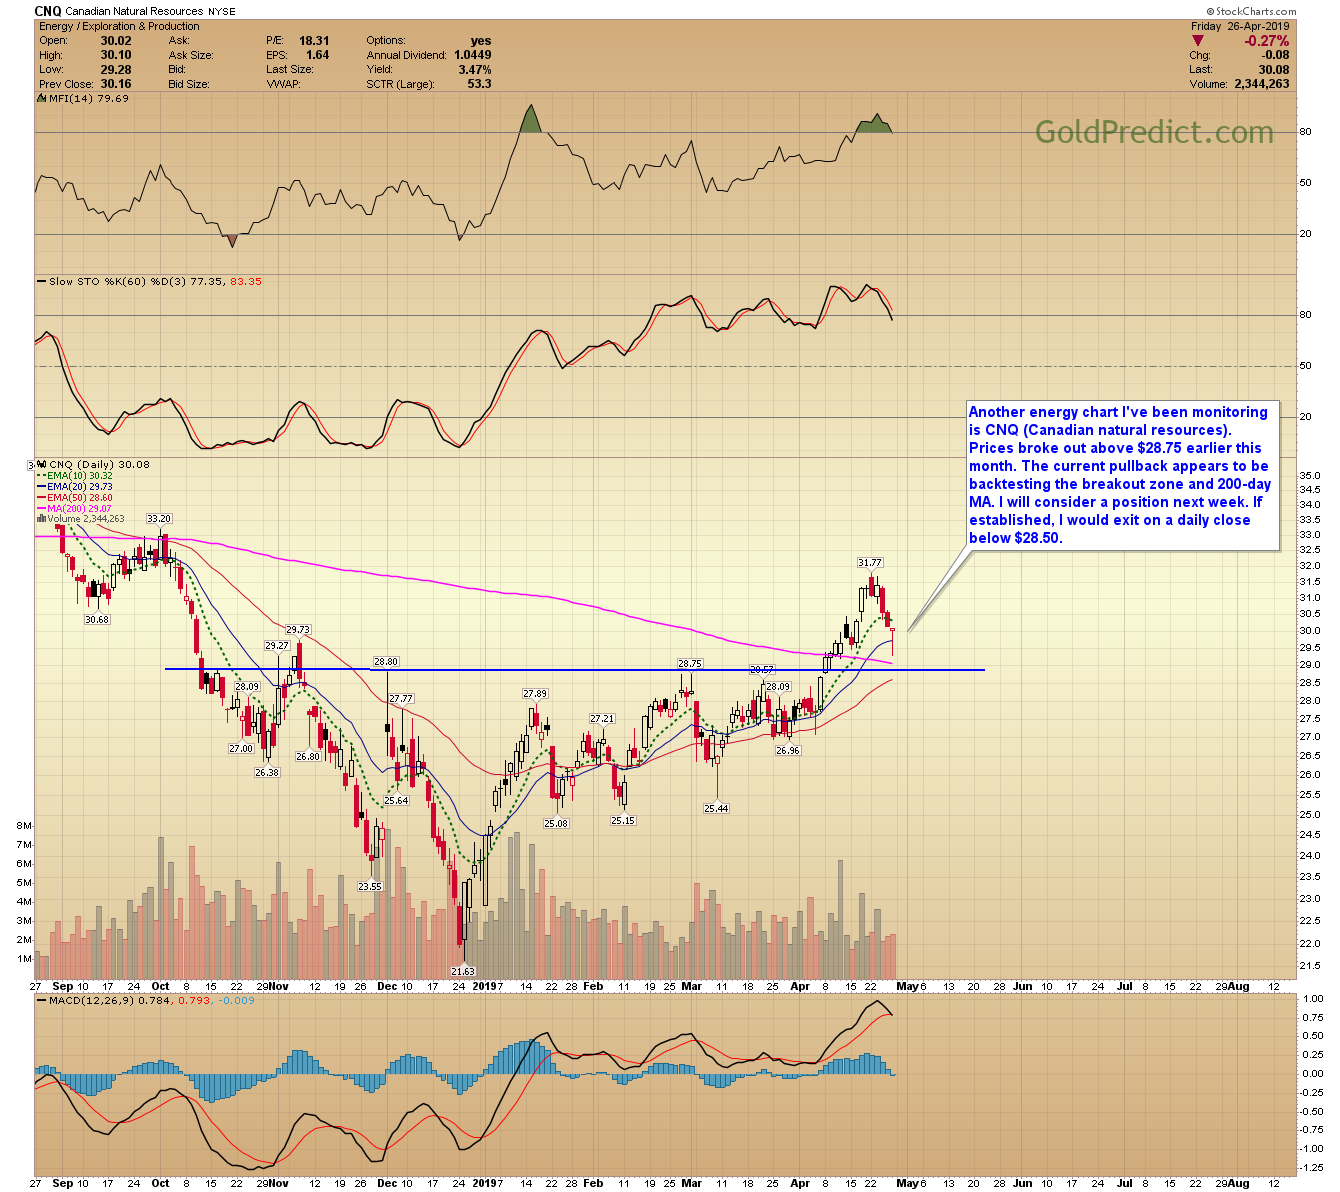
-CNQ- Another energy chart I’ve been monitoring is CNQ (Canadian natural resources). Prices broke out above $28.75 earlier this month. The current pullback appears to be backtesting the breakout zone and 200-day MA. I will consider a position next week. If established, I would exit on a daily close below $28.50.
-GBTC- My outlook concerning Bitcoin and GBTC remains the same. I believe prices reached a momentous parabolic blowoff top in late 2017. It will likely take some time, perhaps years, for sentiment to normalize. I still see significant bullish calls for much higher prices. That leads me to believe sentiment is a long way from the type of investor despair often associated with major bottoms.
The recent rebound to $7.48 in GBTC is likely just a backtest of the prior breakdown described in the August update. Prices should rollover around here and continue to grind sideways/lower in a consolidation that eventually breaks to new lows. If correct, that implies bitcoin will break down below $3000, and I expect to see $1000 and $2000 before prices begin to base.

I included the August GBTC chart below. It appears prices are adhering to my expectations.

Hope you’re having a wonderful weekend.