
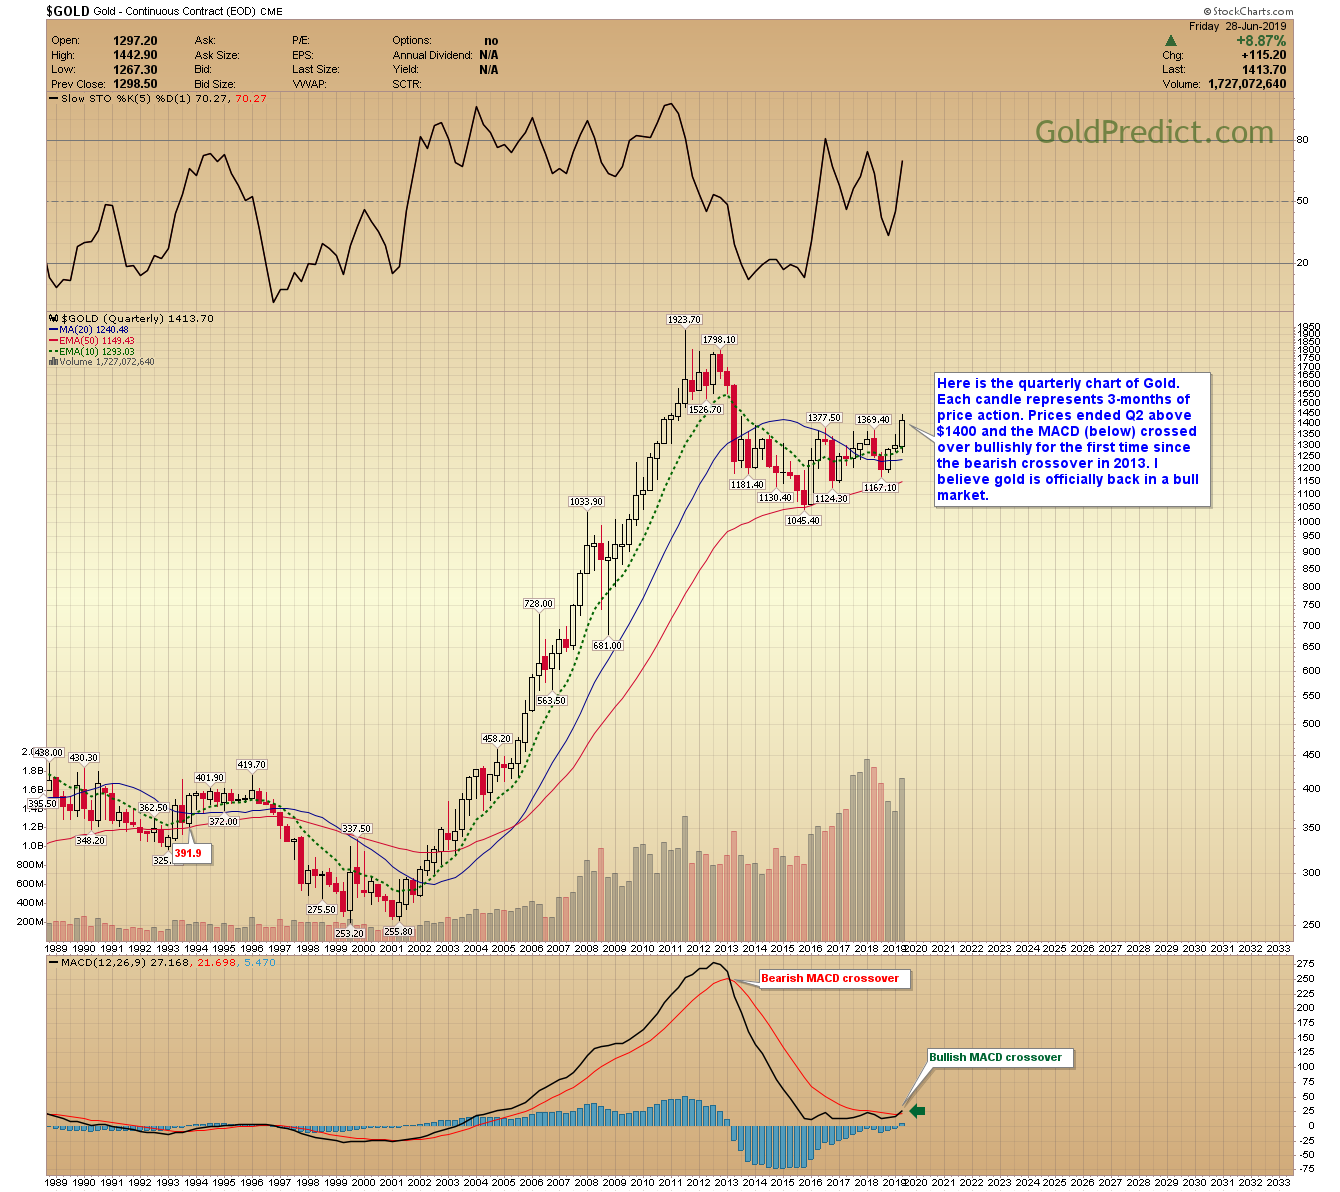
Gold reached several milestones in June 2019. Prices finished the month and subequally the quarter above $1400. The MACD for the quarterly gold chart crossed over bullishly for the first time since 2013. After an arduous 6-year bottoming process, I think it’s safe to say gold started a new bull market.
Now, that doesn’t mean prices will advance directly higher without correcting – that’s not how markets work. But it does mean a trend of higher highs, and higher lows should develop. The 200-day MA will ideally become a floor for prices going forward.
The potential in silver and platinum is compelling. Below is a snippet from an exclusive I wrote for Gold-Eagle.
“Both silver and platinum are lagging gold significantly – some argue a non-confirmation. I think it’s due to their industrial nature. With gold above $1400, it’s probably just a matter of time before investors set their sights on gold’s undervalued cousins.
Think about it. Gold futures are trading at $1433 as I write. Anyone looking to buy may say, “Oh, that is too expensive – what’s cheap?” Well, silver just reached a gold to silver ratio not seen since 1993. Or take platinum – over the last 40-years platinum has traded at a premium to gold about 85% of the time. In fact, in 2000, 2004 and 2008 platinum was more than double the price of gold. Today, platinum futures are trading at $818, some $600 below the price of gold.
Wait – isn’t platinum slipping because the demand for diesel motors is in decline? Yes, catalytic converter demand will wane with the rise of electric vehicles, but that’s a 20-year process (at least). I’d guess less than 1% of all vehicles on today’s roads are 100% electric.
Moreover, something like 70% of all platinum production comes from South Africa. According to www.statista.com, South African production costs were $985 an ounce in 2018. How long will they mine the lion’s share of the world’s platinum supply at a loss? And don’t forget the potential for geopolitical problems (nationalization).”
Click here for the entire article.
All-in-all, June was a historical month for the yellow metal. I believe it signaled the beginning of a new multi-year uptrend. I prefer a long-term strategy of buying the dips and adding aggressively when prices test the 200-day MA. Silver and platinum are incredibly undervalued and should, at some point, begin to outperform gold to correct the historical mispricing.
-GOLD QUARTERLY CHART- Here is the quarterly chart of Gold. Each candle represents 3-months of price action. Prices ended Q2 above $1400 and the MACD (below) crossed over bullishly for the first time since the bearish crossover in 2013. I believe gold is officially back in a bull market.
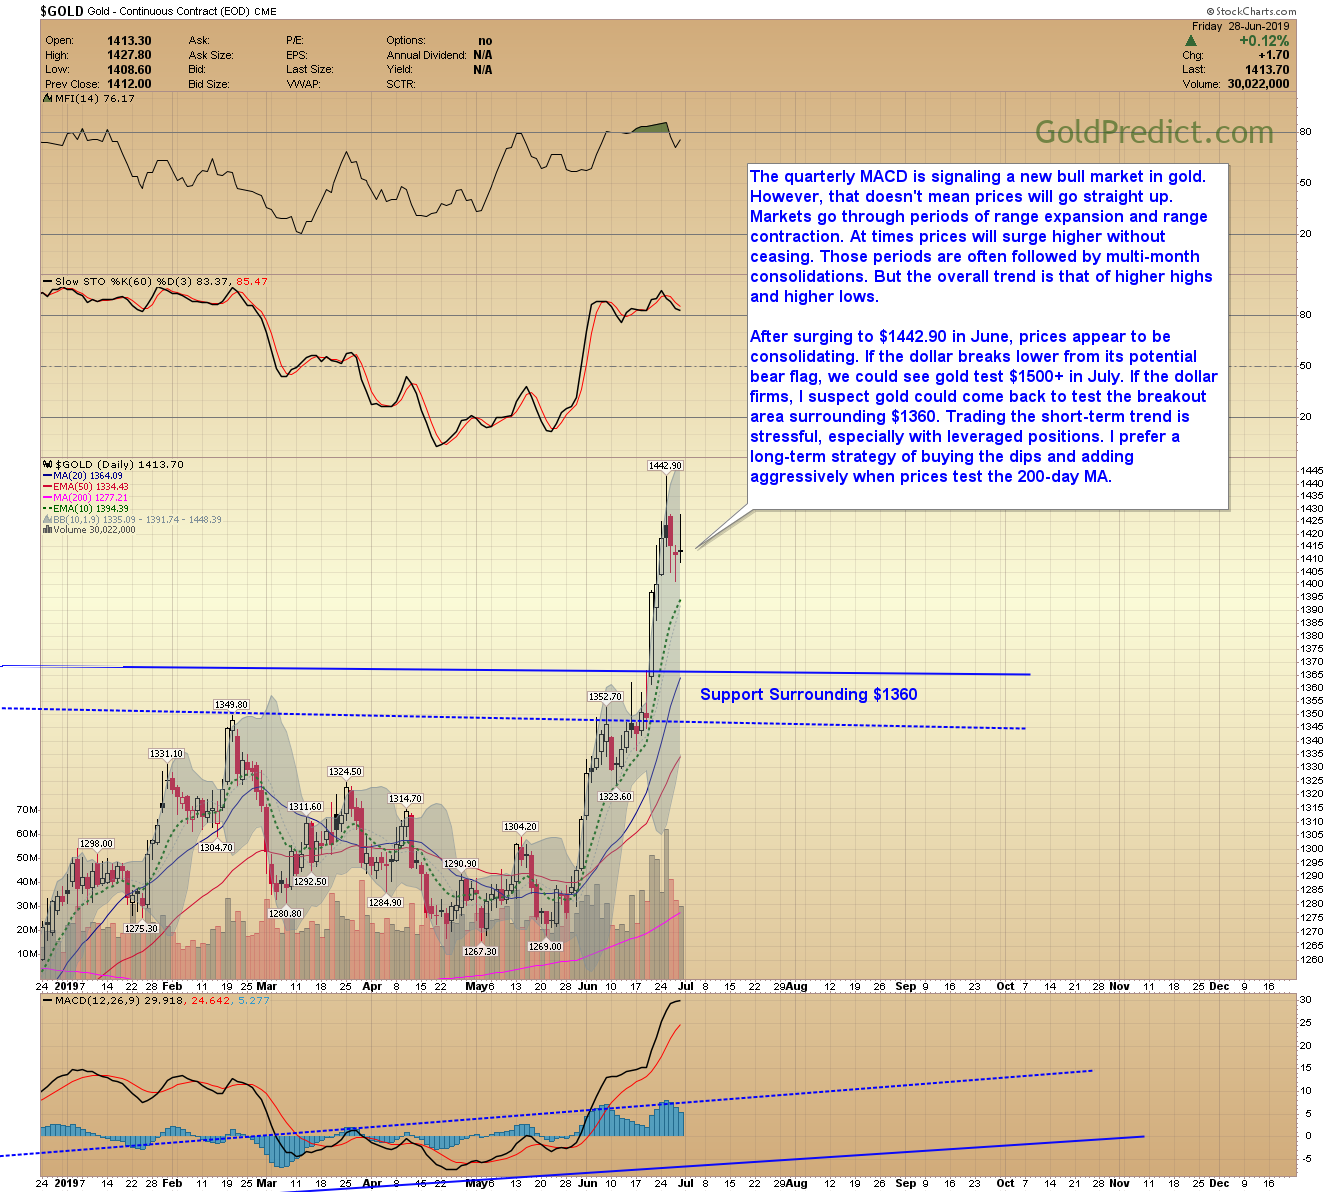
-GOLD DAILY- The quarterly MACD is signaling a new bull market. However, that doesn’t mean prices will go straight up. Markets go through periods of range expansion and range contraction. At times prices will surge higher without ceasing. Multi-month consolidations and sometimes sharp pullbacks follow those periods. But overall the trend is that of higher highs and higher lows. Going forward, the 200-day MA should act as a floor for prices. Corrections to or below the 200-day are often good buying opportunities.
After surging to $1442.90 in June, prices appear to be consolidating. If the dollar breaks lower from its potential bear flag, we could see gold test $1500+ in July. If the dollar firms, I suspect gold could come back to test the breakout area surrounding $1360. Trading the short-term trend is stressful, especially with leveraged positions. I prefer a long-term strategy of buying the dips and adding aggressively when prices test the 200-day MA.
-US DOLLAR DAILY- Technically prices are oversold, but I think they could slip a bit further to test the January low near 94.63. Breaking to new 2019 lows would be dollar negative and gold positive.

-SILVER DAILY- Prices appear to be consolidating above the 10-day EMA. The moving averages converged at $14.95, that level is now support. Silver will probably continue to lag gold prices a bit longer. I think long-term investors can accumulate unleveraged positions at these levels in anticipation of silver playing catchup at some point.

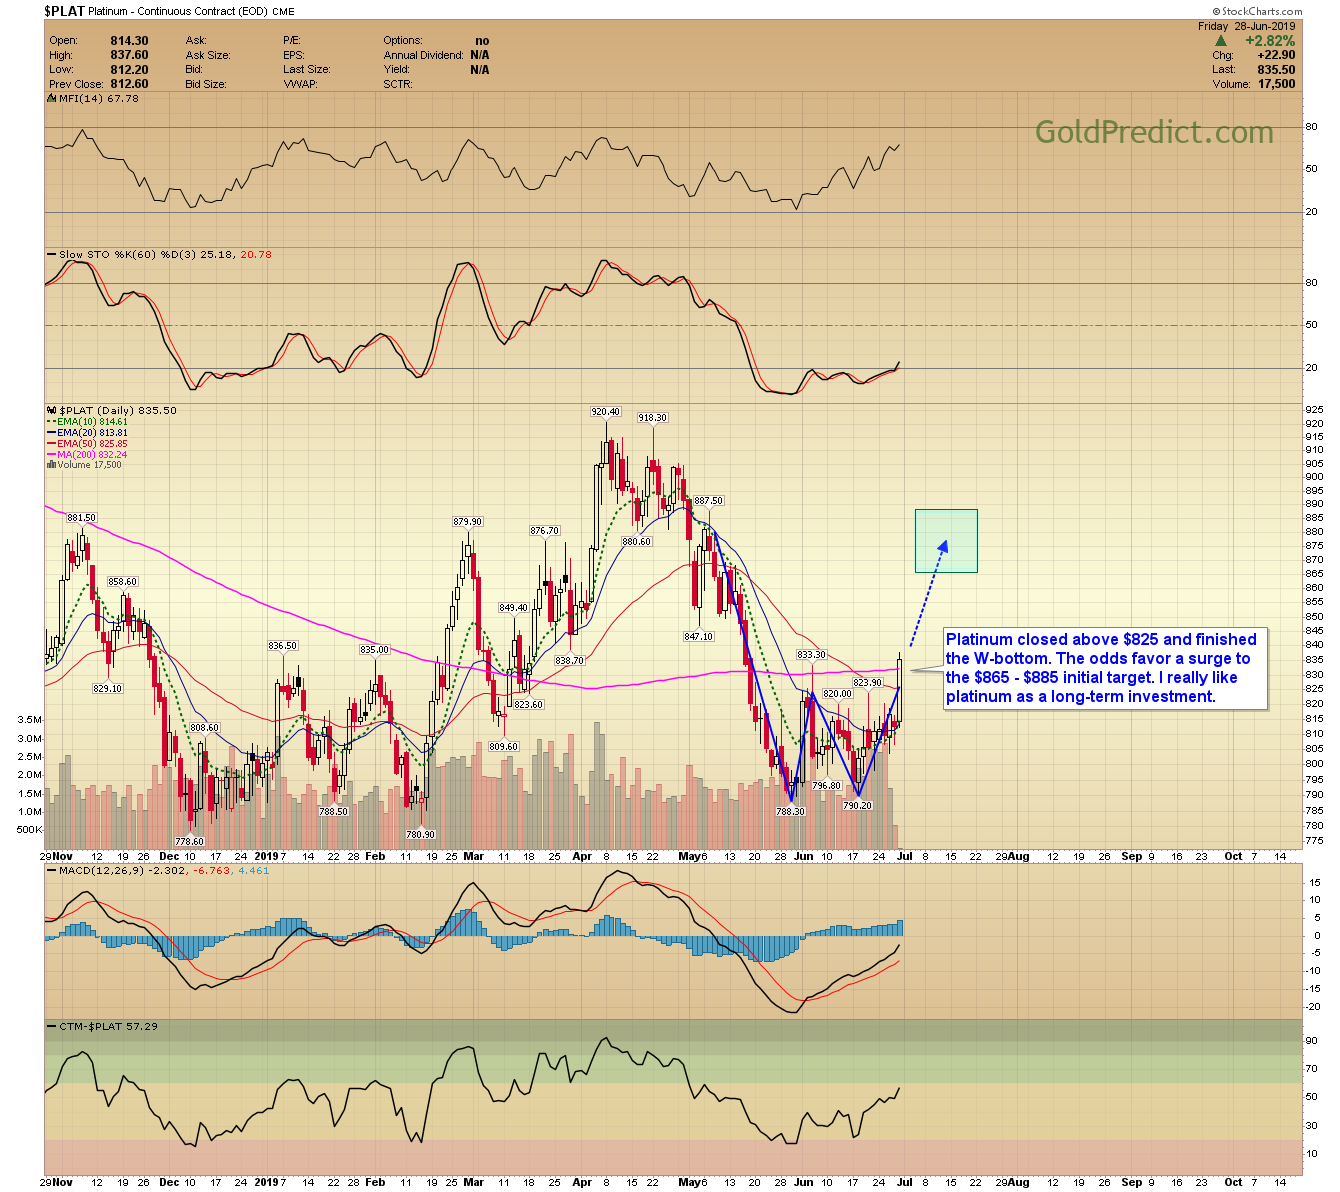
-PLATINUM DAILY- Platinum closed above $825 and finished the W-bottom. The odds favor a surge to the $865 – $885 initial target. I really like platinum as a long-term investment.
-GDX- Miners finished the week above $25.50, and I think they could head higher as long as they don’t close below $24.75. This is contingent on the dollar. The potential measuring gap through $24.25 recommends a $29.00 target if this rally extends and gold tests $1500+.

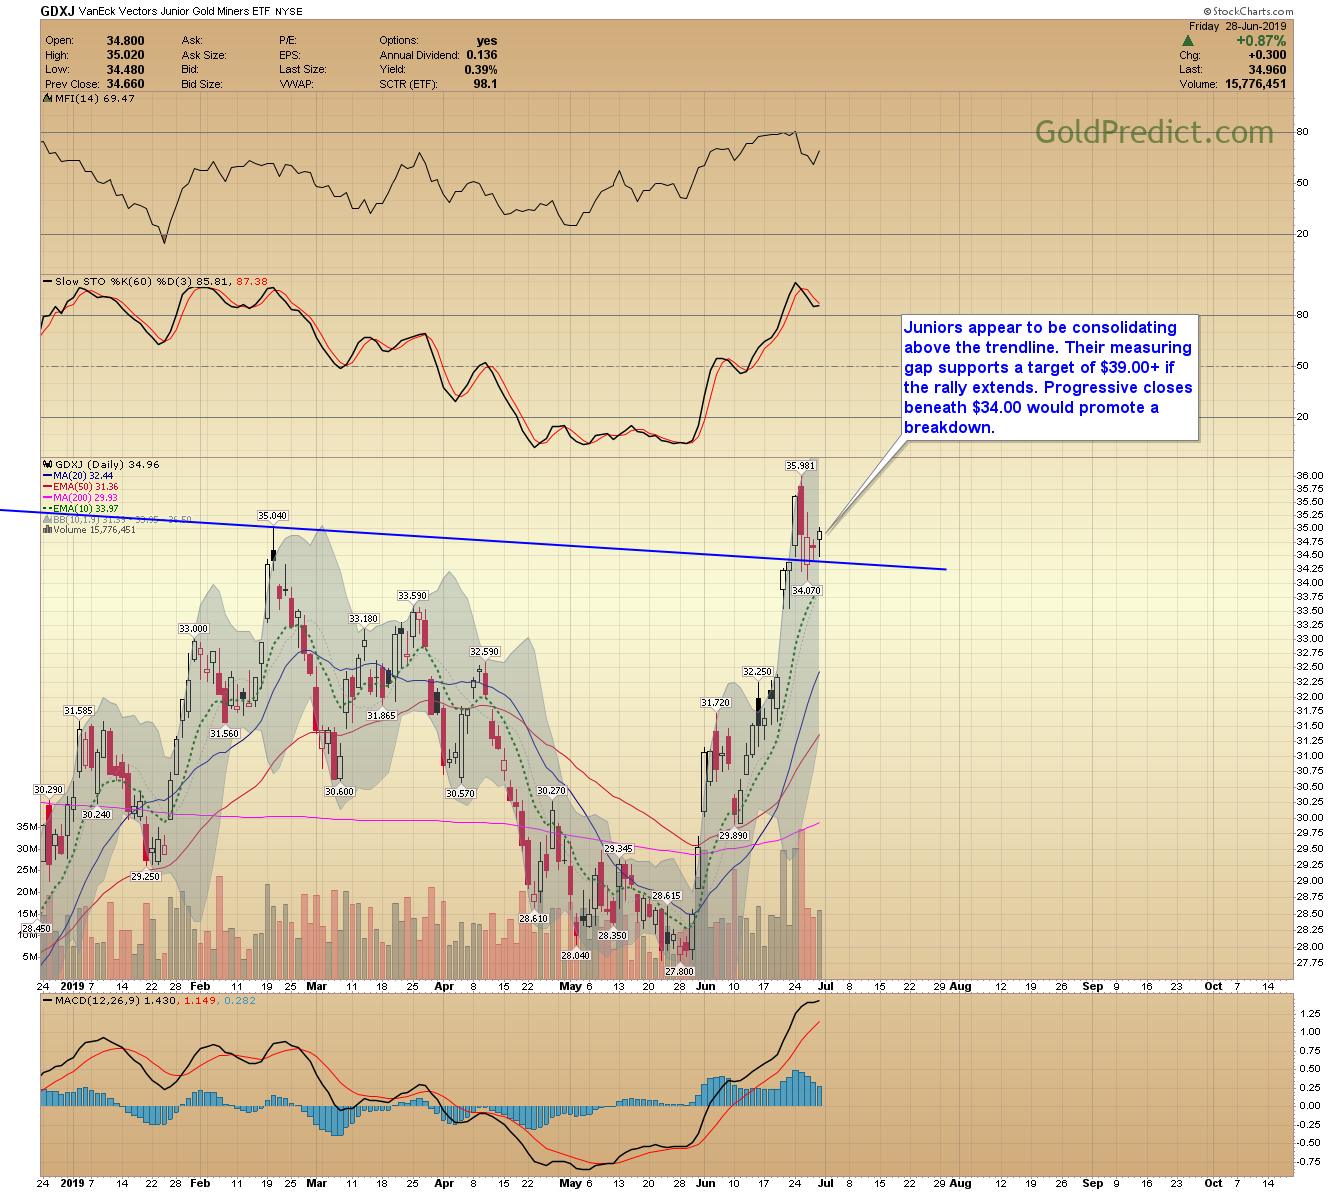
-GDXJ- Juniors appear to be consolidating above the trendline. Their measuring gap supports a target of $39.00+ if the rally extends. Progressive closes beneath $34.00 would promote a breakdown.
-WTIC- Last year, I drew your attention to the years that end with an (8) relationship in oil. After bottoming in an “eight-year” (1988, 1998, 2008, 2018?), prices rally on average 242% in 2-years. Oil crashed into December 2018, and I wondered if the pattern was repeating. Two things typically denote a bottom in the monthly chart.
1) Prices dip below the monthly Bollinger band
2) The CCI slips below -100.
Neither happened in December 2018, although they came very close. So I’m not sure if the pattern will repeat.
Crude would have to rally above the 2018 high ($76.90) in the coming months to support this theory. That would imply an inflationary surge into late 2020. If established, oil prices could target $140 – $148.

Frankly, with everything going on globally, I’m not very confident with what’s going on in oil. Therefore, I’d prefer to focus my investment capital into silver and platinum that I know are undervalued.
A run in oil prices to $140+ by late 2020 is hard to comprehend, and a big IF. However, if it that were to transpire, it would imply a few things.
- A higher stock market. That means no recession and the already extended 10-year business cycle would continue for another year or so. Hard to believe, but I guess anything is possible in today’s central bank manipulated markets.
- An inflationary surge. That implies gold, and all commodities would rise. Gold’s quarterly MACD just signaled a bull market so I can see that.
- Rising gasoline prices would gradually pinch consumers leading to a 2020 or 2021 recession. The stock market frequently tops a few months before commodities, so the stock market would likely peak in Q2 or Q3 of 2020 under this scenario.
Now that’s a lot of IF’s. But if oil were to surge above $76.90 in the coming months, then this will become my preferred outlook.
US Markets are closed Thursday, July 4th. There will be no Thursday report. On Wednesday, July 3rd, markets close at 1:00 PM. The June employment numbers come out on Friday at 8:30 AM. Expect increased volatility. Economists are forecasting 170,000 jobs. The May numbers were dismal at just 75,000 jobs.
Hope you’re having a safe and pleasant weekend.